1. Discrete vs continuous
2. Mean, Mode, Median, Range
3. Calculate the inter-quartile range of the set of data
4. Frequency tables, ungrouped to organize raw data
5. Calculate the mean, mode of the frequency table
6. Predict what will happen to the mean and range if
7. A constant is added to each term
8. Each term is multiplied by a constant
9. Calculate the median of the frequency table
10. Calculate the mean and modal class of grouped data
11. Design a questionnaire that has approax four questions that will give numerical data in their evaluation being free from bias, unambiguous, user friendly, easily analyzed.
12. Draw and interpret both manually and using IT the following charts
13. Pictograms
14. Histograms (equal class interval)
15. Frequency polygons
16. Cumulative frequency curves
17. Use cumulative frequency curves to estimate median and quartiles
18. Use tree diagrams to construct an exhaustive list of the mutually exclusive outcomes of a compound experiment
 Median
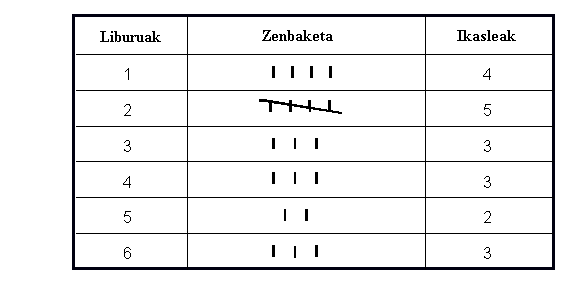 English: frequency table
 Example of Latex frequency table
19. Distinguish between primary and secondary sources of information
20. Distinguish between the following types of sampling
21. Purpose sampling
22. Random sampling
23. Multi-stage sampling
24. Stratified sampling
25. Cluster sampling
26. Panel sampling
27. Make appropriate use of all these forms of sampling.
28. Draw a line graph to represent a trend
29. Interpret a conversion graph
30. Extrapolate and interpolate graphs
31. Recognize the limitations of interpolation and extrapolation
32. Draw a scatter graph for 2 sets of variables
33. Use the terms positive correlation, negative correlation and no correlation to correctly describe the relationship between 2 variables.
34. Distinguish between the following surveying methods
35. Personal interview
36. Telephone interview
37. Observation
38. Electronic Survey
39. Make appropriate use of these methods
40. Use databases and spreadsheets to collate and interrogate raw data
41. Identify...