-ROC greater than zero implies an increase in upward momentum.
-ROC less than zero implies a decrease in downward momentum.
-Divergence indicates a sharp decline if ROC is sloping downwards.
-ROC expands into positive territory as an advance accelerates.
-ROC dives deeper into negative territory as a decline accelerates.
-An upward surge in the Rate-of-Change reflects a sharp price advance.
-A downward plunge indicates a steep price decline.
-Oversold Rate-of-Change: This scan reveals stocks with a positive 125-day Rate-of-Change and an oversold 21-day Rate-of-Change (below -8%). Once these criteria are met, a bullish signal is triggered when the stock closes above the 20-day SMA.
-Overbought Rate-of-Change: This scan reveals stocks with a negative 125-day Rate-of-Change and an overbought 21-day Rate-of-Change (above 8%). Once these criteria are met, a bearish signal is triggered when the stock closes below the 20-day SMA.
-ROC greater than zero implies an increase in upward momentum.
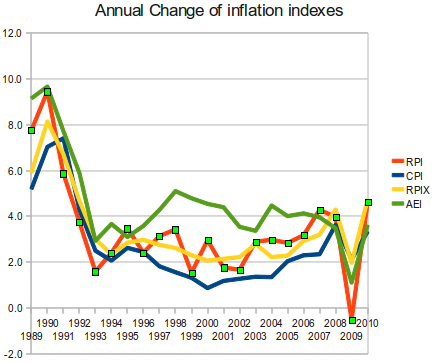 English: Shows the annual rate of change of each o...
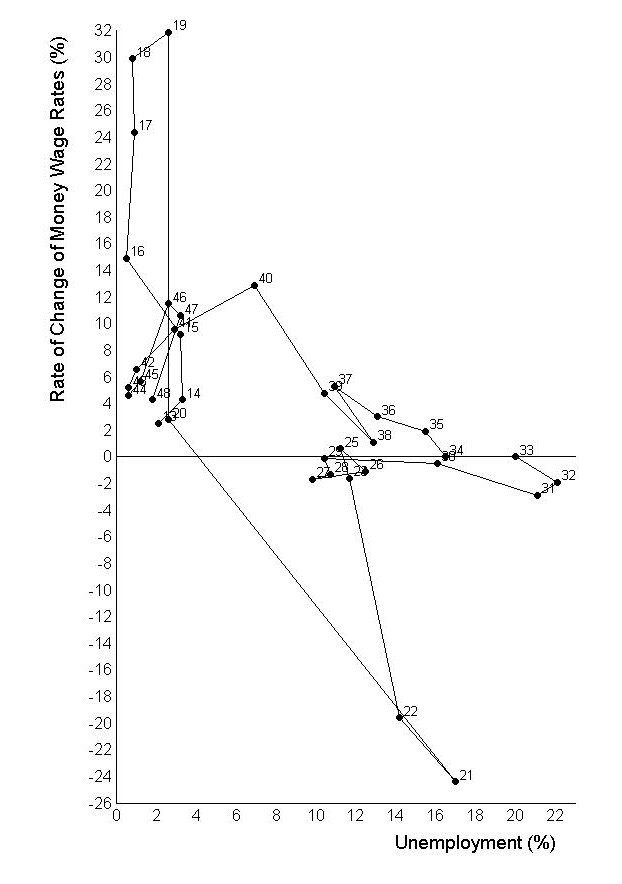 English: The relationship between the rate of chan...
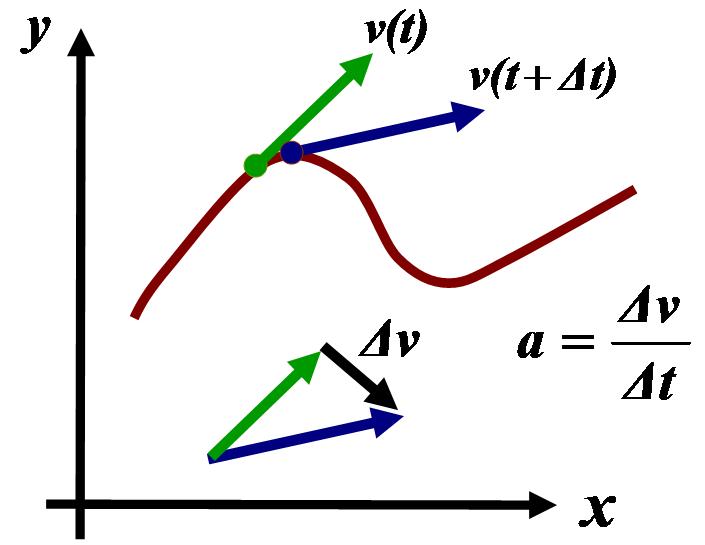 English: Acceleration as derivative of velocity al...
-ROC less than zero implies a decrease in downward momentum.
-Divergence indicates a sharp decline if ROC is sloping downwards.
-ROC expands into positive territory as an advance accelerates.
-ROC dives deeper into negative territory as a decline accelerates.
-An upward surge in the Rate-of-Change reflects a sharp price advance.
-A downward plunge indicates a steep price decline.
-Oversold Rate-of-Change: This scan reveals stocks with a positive 125-day Rate-of-Change and an oversold 21-day Rate-of-Change (below -8%). Once these criteria are met, a bullish signal is triggered when the stock closes above the 20-day SMA.
-Overbought Rate-of-Change: This scan reveals stocks with a negative 125-day Rate-of-Change and an overbought 21-day Rate-of-Change (above 8%). Once these criteria are met, a bearish signal is triggered when the stock closes below the 20-day SMA.
-ROC greater than zero implies an increase in...