Statistical Data Project What the heck is a good set of statistics for this project? That was the question I had to determine first. I like sports, so I figured I would stick with something that would interest me. After thinking of a good team to start with, I chose which set of stats I would use from one of their seasons. I chose the 1999 St. Louis Rams season. The first set of stats that popped out in my mind was there amazing amount of points per game. I made sure that if I used this that it would give me enough points to plot on my graphs, and it did. They play sixteen games in a season so I knew that would be more than enough.
The Project I assessed my data and punched it in the calculator. I used each of my six equations: linear, quadratic, cubic, exponential, power, and logarithmic.
 2003 St. Louis Rams season
 1995 St. Louis Rams season
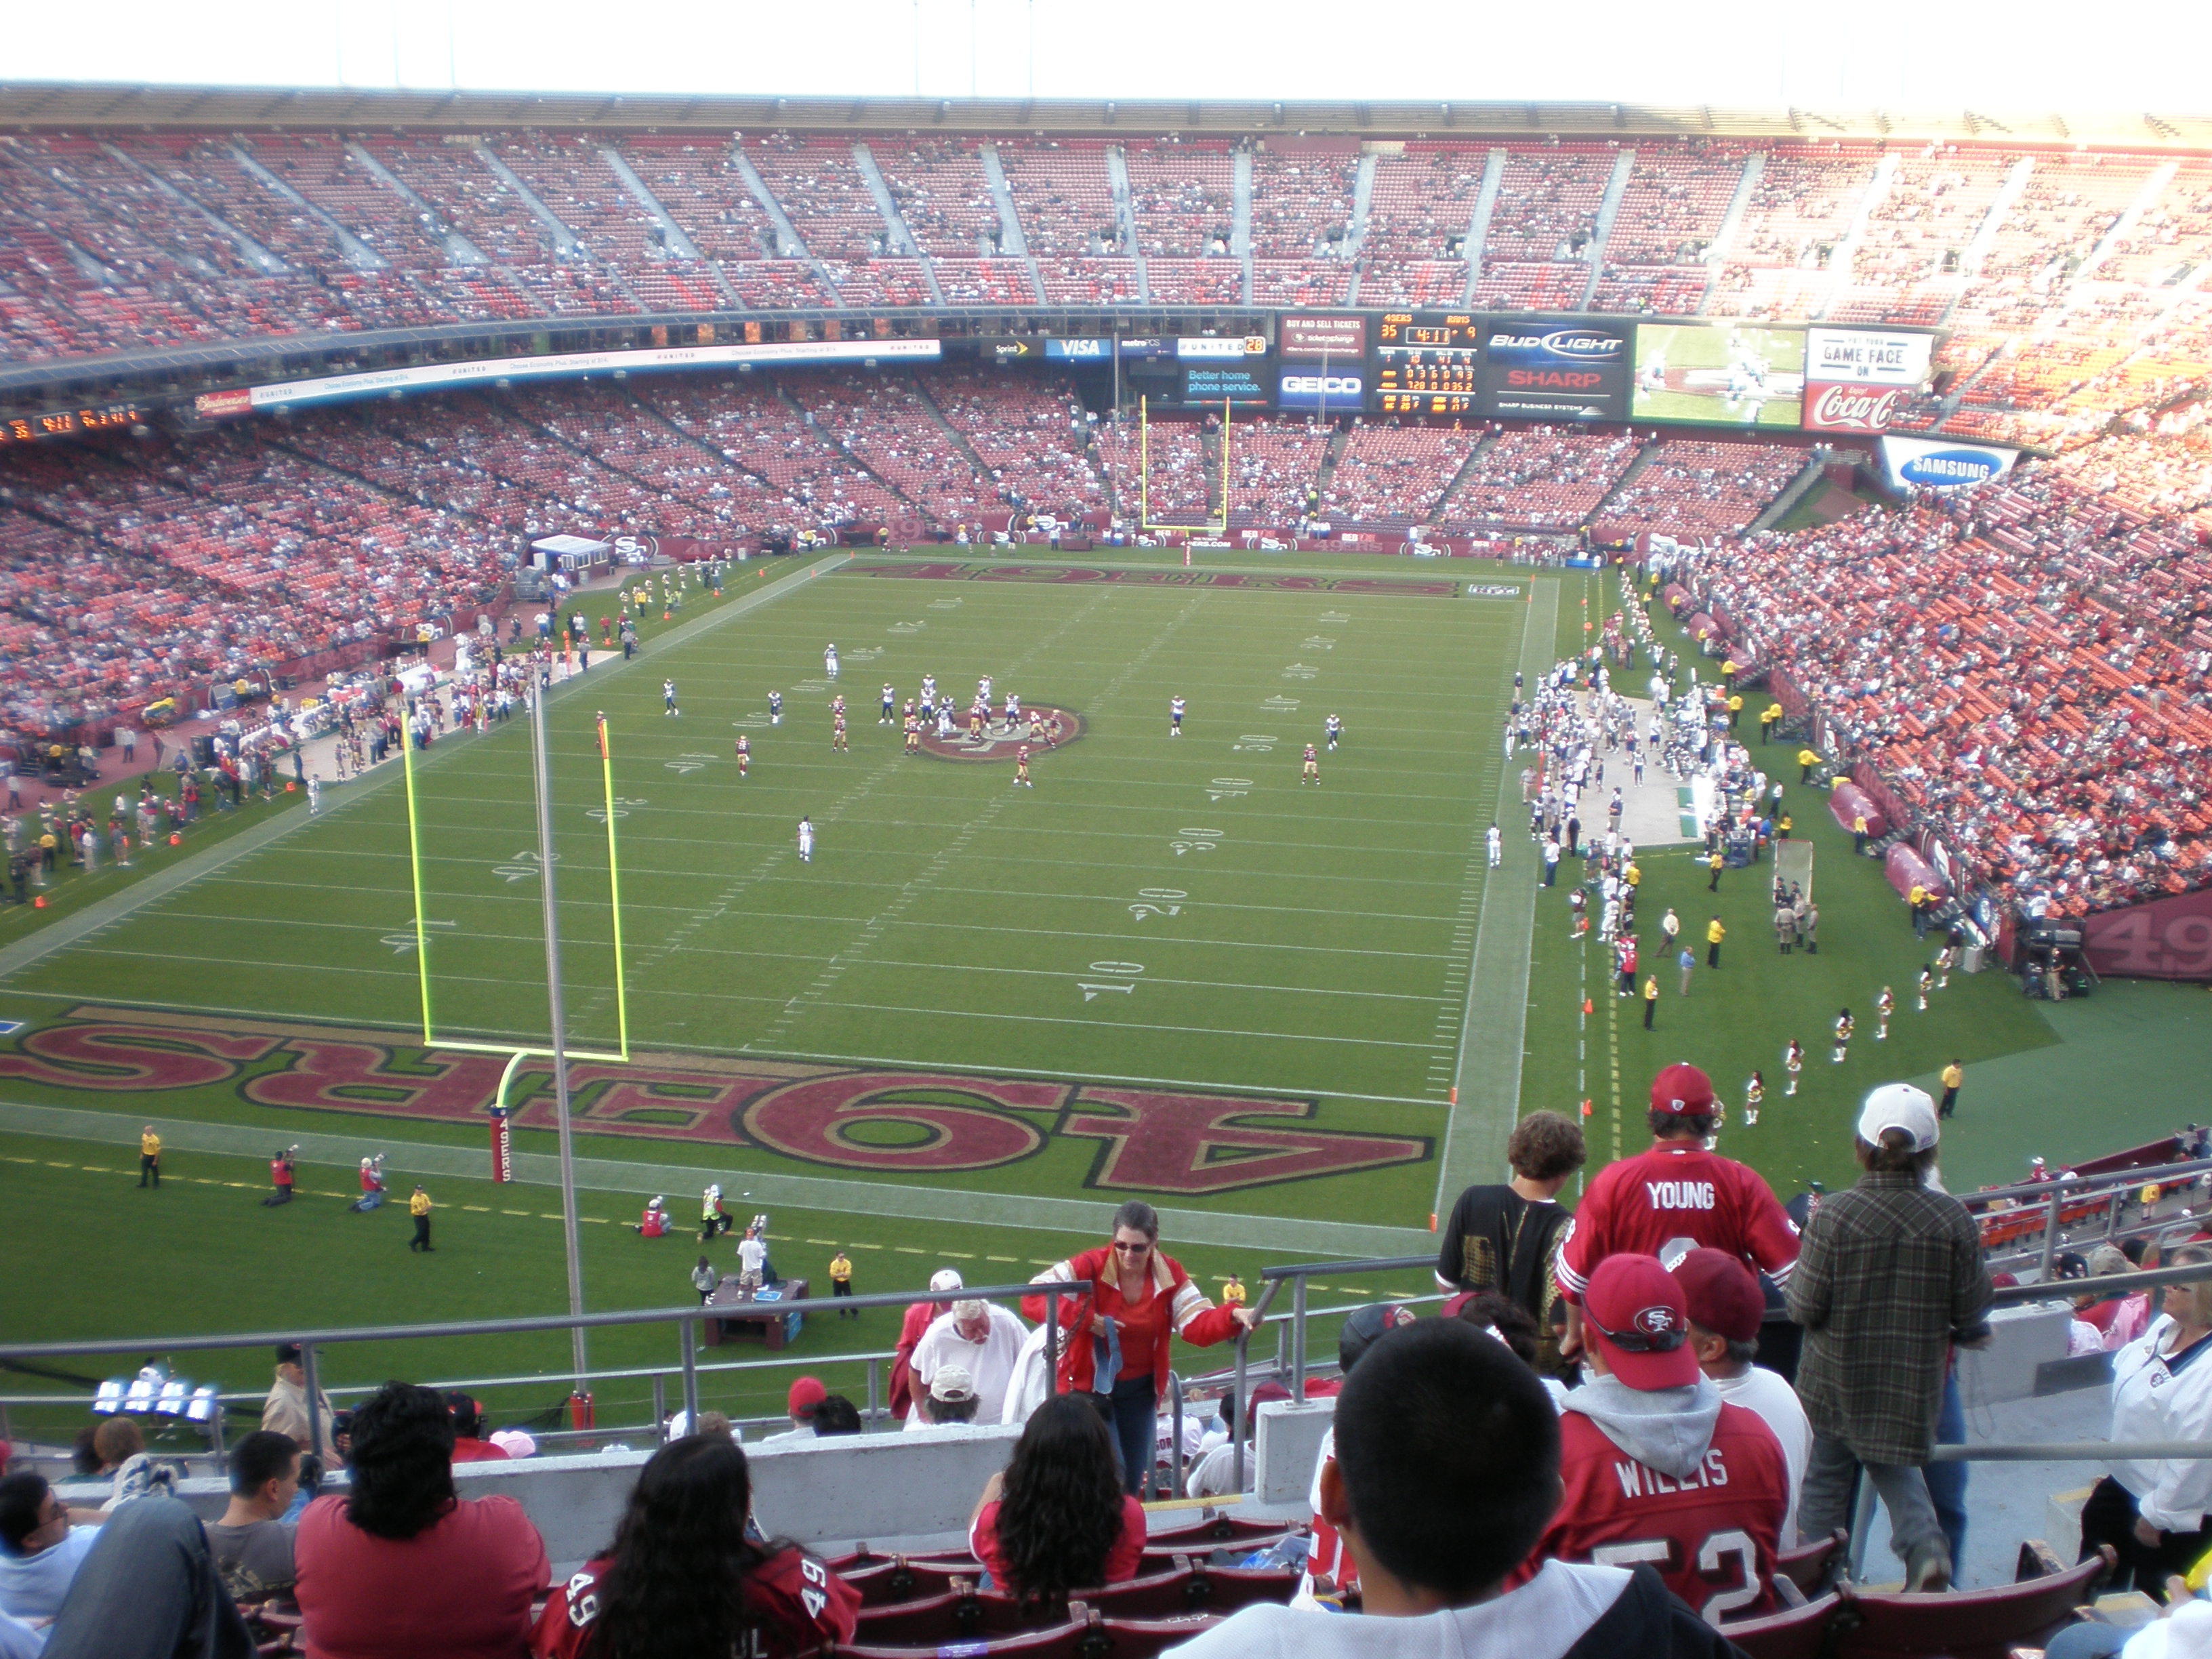 Candlestick Park during a game between the San Fra...
I then took my calculator numbers and submitted them into my Microsoft Excel graphs. I also found the percentage of error (P/E) for each graph. To represent my data for this project I had to find the best graph, and to do that I would have to determine which one had the smallest P/E. My six P/E's were as follows: linear-601.7, quadratic-601.7, cubic-578.48, and exponential-608.1, power-670.1, ln-654.58. The cubic regression had the smallest percentage. That was the one I chose. Next it was time to choose two points of interpolation and extrapolation to help model the prediction of an outcome. These points also came from my cubic equation graph. To find my extrapolation point I want to predict a score to a future game such as a seventeenth game. Under my (x,y) table on my calculator I find that the seventeenth game has a predicted...