YOUR NAME: __ ______________
TEAMMATE'S NAME (if applicable): __________N/A___________________
Module 1 Written Assignment
Due by Wed, June 11 at 11:00 PM EST
Assessing a country's economic development status requires that we consider data on a number of variables. In the Module 1.2 PPT presentation, I presented data of GDP and per capita GDP, but these output measures do not give a complete picture of societal well-being. In this assignment, you will locate and analyze some of the other data that are used to measure economic development status.
1. Income distribution and mobility: Even though per capita GDP is sometimes referred to as "per capita income," it isn't a true measure of individual or household income. (In other words, each American did not receive a check for $50,700 in 2012.) Figures 1.4-1.5 and Table 29.5 provide a better picture of the actual distribution of income. [22 total points]
a. Based on your review of Figure 1.4,
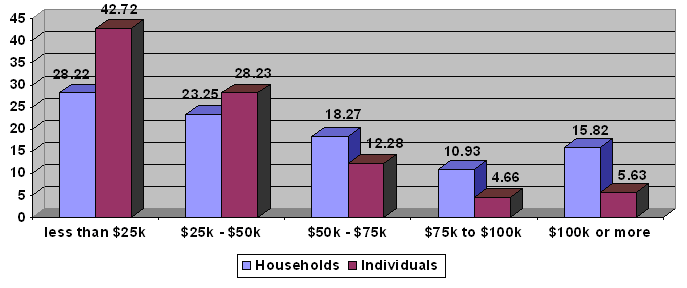 The percentage of households and individuals in ea...
 English: USA. Average After-Tax Income for All Hou...
 English: Distribution of income in the Ricardian s...
describe the current U.S. income distribution. Is it fairly equal? Use data to support your answer. (1-2 sentences) [4 point]
The top/richest fifth of the population received 49.7% of the income, which is just about the same amount of income the rest of the four fifths of the population receives. Because of this ad also the huge gap between the top fifth (49.7%) and the bottom fifth (3.4%), the income distribution is not equal.
b. How has the U.S. income distribution changed since the 1970s? Use data from Figure 1.5 and Table 29.5 to support your answer. (3-4 sentences) [6 points]
Figure 1.5 shows how the bottom three lines(10,20,50 percentiles) remain pretty much constant at a very low income, while the higher the percentiles have an upward trend. When put into percentage terms (or Table 29.5), the percentage of total income received by the...