Economics Report Outline
I. General Macroeconomic indicators
A. Gross Domestic Product (GDP)
1. Definition of GDP.
2. Change in GDP from quarter one to current quarter.
B. Unemployment Rate
1. The change in unemployment rate from October to November.
C. Inflation Rate
1. Explanation of Inflation Rate.
2. Current inflation rate along with graph.
II. Monetary Policy
A. Major announcements by the FED
1. Brief definition of monetary policy
2. The FEDs effects and general announcements.
B. Interest Rates
1. Details on the rise of interest rates.
C. Money Supply Growth
1. Definition of money supply and current changes.
III. Financial Markets
A. Stock Indicators
1. Details on the different indicators that affect U.S. stock
B. Bond Market Indicators
1. Details on the different indicators that affect the Bond Market.
IV. Work Cited
ECONOMIC REPORT
Gross Domestic Product (GDP) is the total market value of all the final goods and services produced within a nation's borders in a given time period.
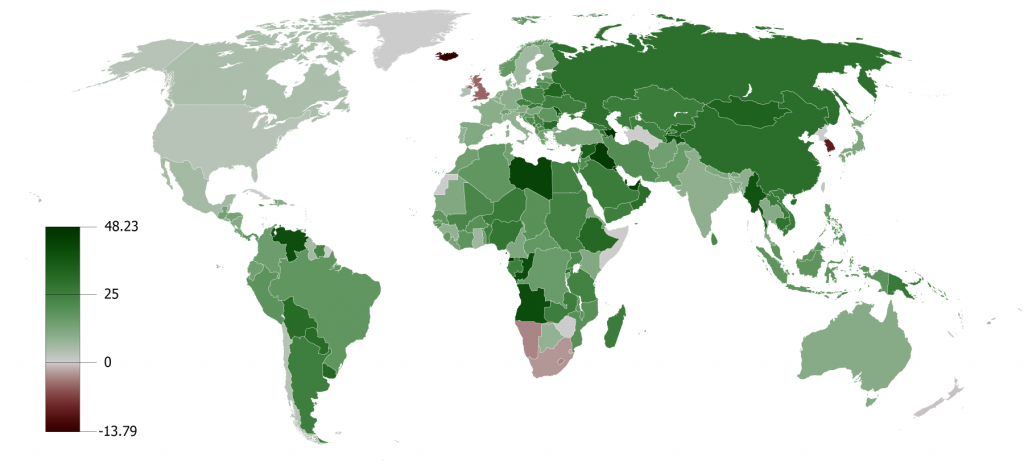 English: Gross domestic product growth from 2007 t...
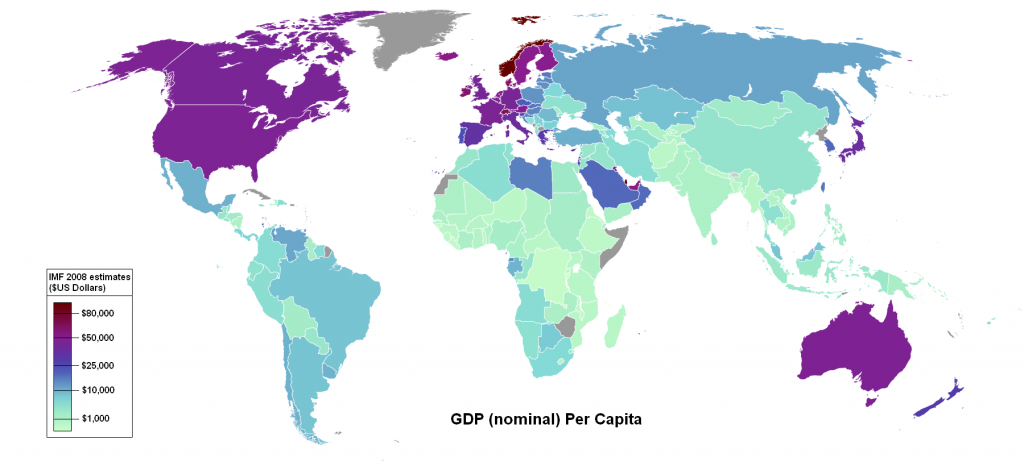 World map showing countries by nominal GDP per cap...
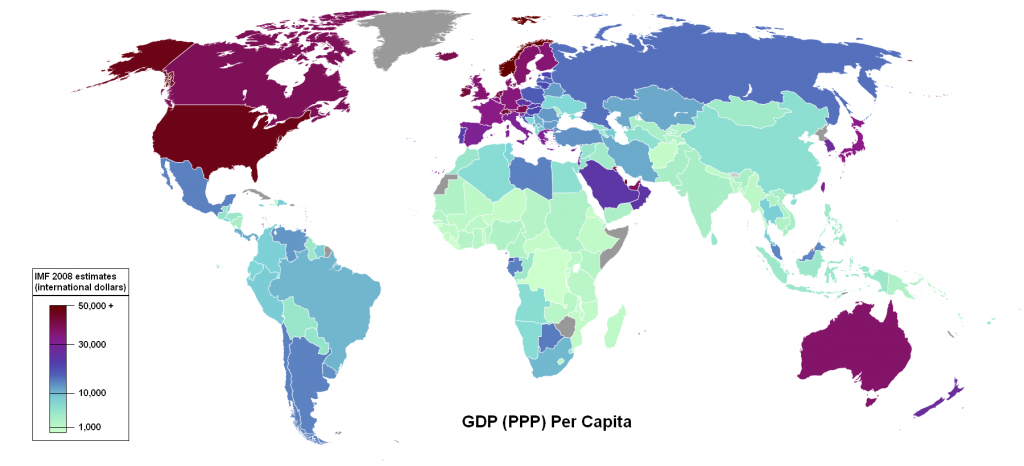 GDP (PPP) Per Capita based on 2008 estimates http:...
Each goods and services produced and brought in the market has a price. The price of the total output is called as GDP. It can be measured by either cumulating all the income earned in the economy or all the spending in the economy and both measures should roughly equate to the same total.
The Gross domestic income includes the following items:
1) Wages and salaries paid to the labor force.
2) Corporate profits earned by the country's businesses.
3) Interest charged by lenders (i.e., banks).
4) Taxes collected by governments.
The Gross domestic expenditure includes the following items:
1) Consumer spending on items such as food, clothing, services, and other items.
2) Investments in plant, equipment, inventories & household residences.
3) Government spending for defense, roads, schools, and other items.
4) The value of exports minus imports.
Two ways to measure GDP
1) Nominal GDP is the value of final output produced in a given period, measured in the prices of that period (current period). As the price level changes everyday, both real and nominal GDP are regularly reported. Nominal GDP is computed simply by adding the current dollar value of the production.
2) Real GDP is the value of final output produced in a given time period, adjusted for changing prices. Real GDP is the inflation adjusted value of nominal GDP. Real GDP is calculated by adjusting the market value of goods and services for changing price.
GDP indicates the current health of an economy. It is the basic measure of an economy's size. GDP provides a useful perspective on the way the economy works. It shows how factor markets relate to product markets. It shows how output relates to income. It shows how consumer spending and business investment relate to production. It also shows how the flow of taxes and government spending may alter economic outcomes.
GDP in has risen since quarter one of this year. Currently GDP level is at $11, 810 billion. In the first quarter it was $11, 472.6 billion which is an increase of $337.4 billion. Estimates released November 30, 2004 by the Bureau of Economic Analysis show that real GDP grew 3.9 percent (annual rate) in the third quarter of 2004. The gap between U.S. exports and imports and the amount of U.S. borrowing is getting larger. The U.S. is expected to borrow $670 billion from the rest of the world. The graph below shows the change in the Real GDP.
Employment rose in November, and the unemployment rate, at 5.4%, was essentially unchanged, the Bureau Labor of Statistics of the U.S. department of Later announced December 3, 2004. The jobless rate has been either 5.4 or 5.5 percent in each month since July. It's been an up-and down year for the U.S. job market and November continued the pattern. The U.S. non-farm payrolls grew by just 112,000 jobs in November, down from October's 303,000 gain and far short of economists' consensus forecast said the Bureau of Labor Statistics. Total employment in November grew by 483,000 to 140.3 million. The chart below shows the change from November to October employment and unemployment.
Inflation is defined as an increase in the average level of prices of goods and services in an economy. It is also defined as the overall general upward price movement of goods and services in an economy, usually as measured by the Consumer Price Index and the Producer Price Index. The Consumer Price Index (CPI) measures inflation as experienced by consumers in their day-to-day living expenses. The Producer Price Indexes (PPIs) are a family of indexes that measure changes in the selling prices received by domestic producers of goods and services.
The Fed actively tries to maintain a specific rate of inflation, which is usually 2-3% but can vary depending on circumstances. The Labor Department reported November 18, 2004 that consumer prices were up 3.2% in the 12 months through October, up from a 2.5% rate in the 12 months through September. Energy prices rose 4.2% in October alone from the month before. The Federal Reserve officials believe inflation risks are on the rise. They suspect the inflation might increase because of slowing productivity growth, lower dollar, high energy and commodity prices, and recent inflation data. The Consumer Price Index for All Urban Consumers (CPI-U) increased
0.5 percent in October which is 3.2% the Bureau of Labor Statistics of the U.S. Department of Labor reported November 17, 2004. The chart below shows how the inflation rate remains low but has potential to increase.
Monetary policy is made by the Federal Open Market Committee, which consists of the Board of Governors of the Federal Reserve System and the Reserve Bank presidents. The Federal Reserve controls the three tools of monetary policy open market operations, the discount rate, and reserve requirements. The Board of Governors of the Federal Reserve System is responsible for the discount rate and reserve requirements, and the Federal Open Market Committee is responsible for open market operations.
There are several announcements made by the FED during the past three months but the main change was the dollar price. The dollar reached a low for 2004 versus the yen announced by the Federal Reserve Chairman Alan Greenspan. The dollar fell to �3.18 which was at �4.19 before. The U.S. dollar is drooping; it's down about 9% against other major currencies since August 2004. The dollar has also hit its low against the euro announced by the FED on December 3, 2004. The dollar has fallen 3.75% on a trade weighted basis, 6% against the yen and about 5% against the euro. The dollar decline also affected the crude oil prices which is more then half a dollar of $42.46 per barrel that used to be $50 a little over a week ago.
The Federal Reserve raised interest rates for the fourth time this year and will plan to keep on increasing them in the future. On November 11, 2004 the FED raised its short-term interest-rate target to 2% from 1.75%. Several commercial banks responded by raising the prime rate , a benchmark for commercial and consumer loans, to 5% from 4.75%. The raise on interest rates did not mean great news for savers. The rates on savings, interest-bearing checking and money-market deposit accounts have hardly budged in recent months, the average pays 0.51%. The good news is that the yields on money-market mutual funds, which had dropped as low as 0.50% in mid-2003 are now average 1.24%. The FED will continue to increase the interest rate and are expected to do so December 14th meeting which could lead to 3% to 5% increase in the long run.
Money supply is the total supply of money in circulation in a given country's economy at a given time that involves the FED, banks, depositors and borrowers. It consists of M1, M2, and M3 which is the measure of money supply in the U.S. M1 is a measure of the money supply that includes all coins, currency held by the public, traveler's checks, checking account balances, and balances in credit unions. M2 is a measure of the money supply that includes M1, plus savings and small time deposits and non-institutional money market accounts. M3 is a measure of the money supply that includes M2, plus large time deposits and institutional money market accounts. The chart below shows the current money supply in the U.S. from the year of 2004.
Financial markets involve both stocks and bonds that fluctuate depending on the economic status. Reported by the Wall Street Journal on December 3, 2004 the U.S. stocks finished higher then usual and another drop in oil prices helped to ease the poor performance. The fall of the barrel of crude oil to $43 helped the stock market "off to the races." The S&P 500 hit a three year high rising up to 7% this year and the NASDAQ to a 10 month high of 1.98% increase reported by the Wall Street Journal on December 2, 2004. There are several mainstream investors such as Steve Leuthold, Tim Swanson and Ray Dalio that are pulling away from the U.S. market and going abroad. The chart below shows how many billion of U.S. dollars go abroad, which reflects both stock and bonds prices.
Since the Federal Reserve raised the short-term interest rate the Treasury bonds have risen in price. Rising rater are usually bad for bonds, because new bonds, with the higher rate, return more money then existing bonds. That causes the price of the older bonds to fall. Yet the Wall Street Journal announced on November 30, 2004 that the Bond Market fell due to foreign investors cutting back on purchases of U.S. government securities. The 10-year Treasury suffered its worst day in three weeks with the prices falling 24/32. In September the Japan's holding the U.S. treasury securities declined for the first time since October 2002 falling to $720.4 billion from $721.9 billion in August. Yet corporate bonds are expected to burst that could total $10 billion to $12 billion a week for the next two or three weeks.
WORK CITED:
1). Mark Gongloff, November 30, 2004, Warning Signs For U.S. Economy, The Wall Street Journal Online
2). Justin Lahart, November 30, 2004, Profit Picture, The Wall Street Journal Online
3). Aaron Lucchetti, November 30, 2004, Bond Market Finally Flinches, The Wall Street Journal Online
4). E.S. Browning, December 2, 2004, Stocks Climb As Managers Pump in Money, The Wall Street Journal Online
5). E.S. Browning, November 24, 2004, In Tug-of-War on Stocks, Some Pull Away From the U.S. Market, The Wall Street Journal Online
6). Anonymous, December 2, 2004, Dollar Signs Behind Big Drop in Currency: Imbalance in Global Economy, The Wall Street Journal Online
7). çÂÂçÂÂçÂÂçÂÂG. Thomas Sims, November 29, 2004, European Central Bank Leans Toward Higher Rates, The Wall Street Journal Online
8). çÂÂçÂÂçÂÂçÂÂLaurence Norman, DOW Jones Newswires, November 19, 2004, Dollar Hits Year Low Against Yen As Greenspan Speaks, The Wall Street Journal Online
9). çÂÂçÂÂçÂÂçÂÂAaron Lucchetti, November 22, 2004, Wall Street Fears Bad Side Effects Of Dollar's Fall, The Wall Street Journal Online
10). çÂÂçÂÂçÂÂçÂÂDOW Jones Newswires, December 3, 2004, Summary of U.S. Employment Data-Establishment Survey, The Wall Street Journal Online
11). çÂÂçÂÂçÂÂçÂÂMark Gongloff, December 3, 2004, Jobs: Down for the Up Stoke, The Wall Street Journal Online
12). çÂÂçÂÂçÂÂçÂÂGreg Ip, December 2, 2004, Fed View Shifting On Inflation; Rate Rises Likely, The Wall Street Journal Online
13). çÂÂçÂÂçÂÂçÂÂJon E. Hilsenrath, November 18, 2004, Inflation Perks Up as the Fed Weighs Pace of Rate Increases, The Wall Street Journal Online
14). çÂÂçÂÂçÂÂçÂÂGreg Ip, November 11, 2004, Fed Raises Short-Term Rate to 2%, The Wall Street Journal Online
15). çÂÂçÂÂçÂÂçÂÂBureau of Labor Statistics, www.bls.gov
16). çÂÂçÂÂçÂÂçÂÂBureau of Economic Analysis, www.bea.gov
17). çÂÂçÂÂçÂÂçÂÂFederal Reserve, www.federalreserve.gov