Biology Practical Assignment
Name of Investigation:
Effect of Eutrophication on Plant Growth
Research Question:
How does the process of Eutrophication affect the growth of Duckweed?
Hypothesis:
In this experiment, we are basically testing the use of different fertilizers on the growth of Duckweeds. Plants need fertilizers for their growth and to increase the yield of crops. But, at the same time, it depends on which Fertilizer being used and in how much proportion. Does it have sufficient nutrients or excessive nutrients? These were the questions, which I asked myself and through some research, I was able to write my Hypothesis.
According to me, at the beginning, the growth of the duckweeds would increase but slowly after 6-7 days, they would perish. Duckweeds are those types of plants that require fertilizers for the development of their roots, and Phosphorus fertilizers are the ones who have this ability. On the other hand, Nitrates or Nitrogen fertilizers in an excessive concentration would give an excessive amount of proteins to the duckweeds which would not be needed by them and hence concentrated nitrogen won't be that helpful for their growth.
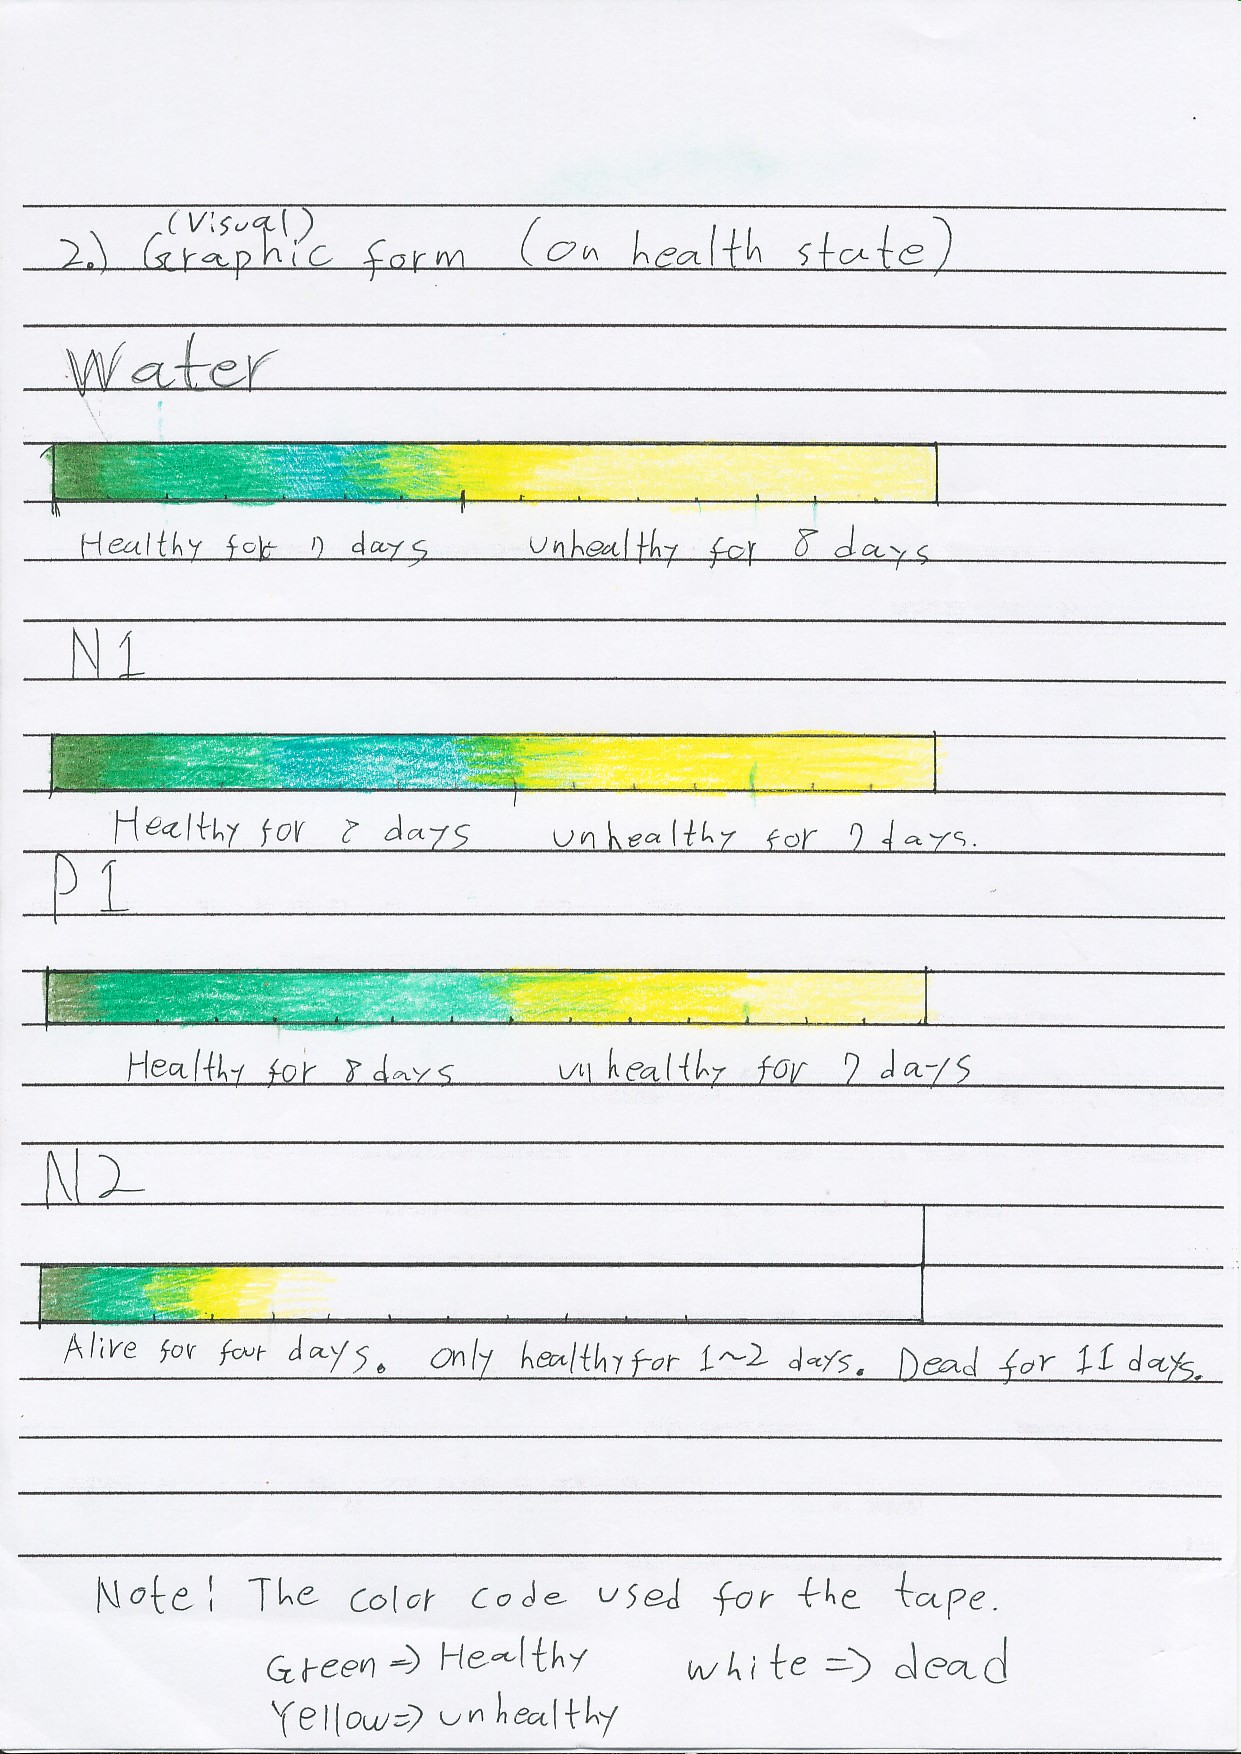 Figure 1
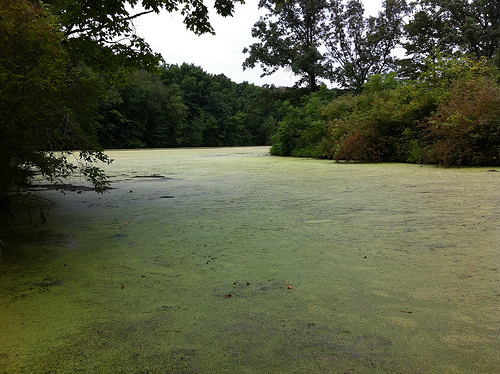
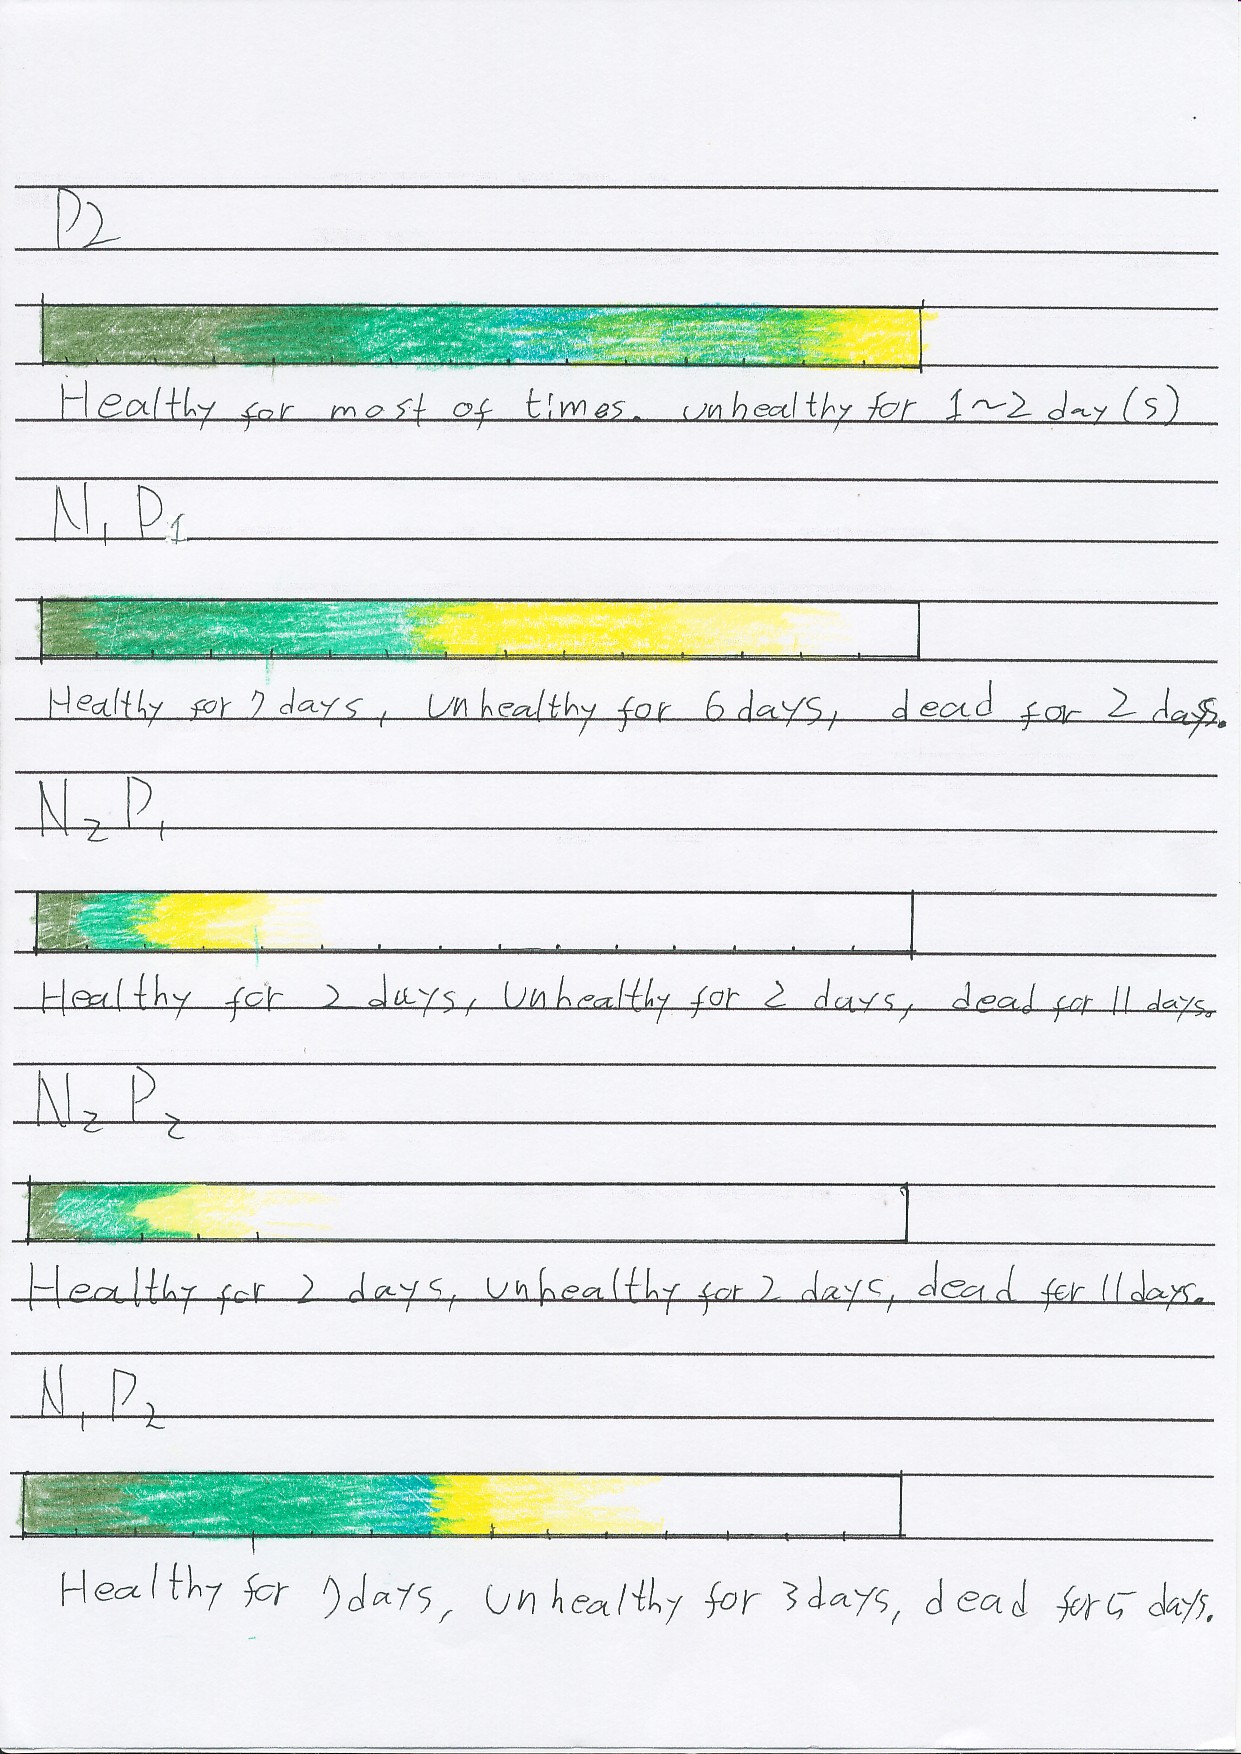 Figure 2
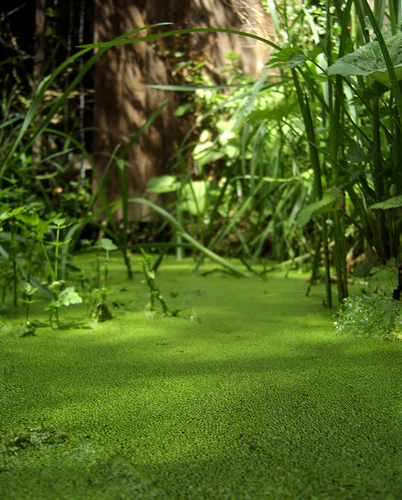 Duckweed
Tap Water would also be a good fertilizer for the duckweeds since it contains sufficient nutrients and hence would help in the growth of the plants.
Reason for Hypothesis:
As I mentioned on top, the plants would start to multiply as they have sufficient minerals for their growth and through constant sunlight, they would increase in numbers (except concentrated nitrates). Later on, they would slowly start to perish leaving a white color. This would happen because the plants must have used up all the minerals for a period of time, and hence due to fewer minerals they might have died. Overcrowding and the effect of Eutrophication (rapid growth) must have decreased their growth as well.
Materials Required:
9 Plastic Containers
Low and High concentration of Nitrates
Low and High concentration of Phosphates
Tap Water
90 Duckweeds
Measuring Cylinder
Variables Involved:
What will Change? | What will be kept the same? | What will be measured? |
Type of Fertilizers Concentration of Fertilizers (Each plastic container would have a different type of fertilizer, in a different concentration) | Sunlight Temperature Amount of Fertilizers (These measures would vary from container to container but to get the most appropriate results, we are considering these factors being constant) | The increase or decrease in the number of duckweeds (Our Aim is to measure the number of duckweeds and this is the only factor being measured every alternative day) |
Method:
Outline in steps how the test will be carried out, indicating how the control variables will be kept the same.
First of all, we put 100ml of each fertilizer in different plastic containers-N1, N2, P1, P2, N1P1, N1P2, N2P1, N2P2, Water (Where 1 stands for low concentration and 2 stands for a higher concentration).
By putting 10 duckweeds in each container, we let them expose to open sunlight
Finally, count the number of duckweeds each alternative day and at the end of 10 readings, make a tabular form from them and hence plot a graph for the growth of Duckweeds from each fertilizer.
We have also assumed that each container would get the same amount of Sunlight and the temperature would be same to have the appropriate readings. Through the constant exposure to sunlight, the effect of Eutrophication would emerge for the plants and the plants would start to perish. Even the fertilizer in the container would be evaporated and crystallized. Probably, the death rate of most of the duckweeds would be faster than their birth rate because the loss of nutrients would have a tremendous affect on their growth.
Results:
Tables
Date | 23/09/05 (Friday) Day 1 | ||||||||
Type of Fertilizer | N1 | N2 | P1 | P2 | N1P1 | N1P2 | N2P1 | N2P2 | Water |
No. of Duckweeds | 10 | 10 | 10 | 10 | 10 | 10 | 10 | 10 | 10 |
Date | 26/09/05(Monday) Day 2 | ||||||||
Type of Fertilizer | N1 | N2 | P1 | P2 | N1P1 | N1P2 | N2P1 | N2P2 | Water |
No. of Duckweeds | 14 | 0 | 14 | 18 | 17 | 20 | 7 | 9 | 19 |
Date | 28/09/05(Wednesday) Day 3 | ||||||||
Type of Fertilizer | N1 | N2 | P1 | P2 | N1P1 | N1P2 | N2P1 | N2P2 | Water |
No. of Duckweeds | 17 | 0 | 16 | 21 | 17 | 13 | 0 | 0 | 25 |
Date | 30/09/05(Friday) Day 4 | ||||||||
Type of Fertilizer | N1 | N2 | P1 | P2 | N1P1 | N1P2 | N2P1 | N2P2 | Water |
No. of Duckweeds | 10 | 0 | 7 | 30 | 8 | 7 | 0 | 0 | 29 |
Date | 3/10/05(Monday) Day 5 | ||||||||
Type of Fertilizer | N1 | N2 | P1 | P2 | N1P1 | N1P2 | N2P1 | N2P2 | Water |
No. of Duckweeds | 7 | 0 | 7 | 25 | 5 | 3 | 0 | 0 | 18 |
Date | 5/10/05(Wednesday) Day 6 | ||||||||
Type of Fertilizer | N1 | N2 | P1 | P2 | N1P1 | N1P2 | N2P1 | N2P2 | Water |
No. of Duckweeds | 5 | 0 | 5 | 19 | 1 | 0 | 0 | 0 | 13 |
Date | 7/10/05(Friday) Day 7 | ||||||||
Type of Fertilizer | N1 | N2 | P1 | P2 | N1P1 | N1P2 | N2P1 | N2P2 | Water |
No. of Duckweeds | 3 | 0 | 3 | 15 | 0 | 0 | 0 | 0 | 9 |
Date | 10/10/05(Monday) Day 8 | ||||||||
Type of Fertilizer | N1 | N2 | P1 | P2 | N1P1 | N1P2 | N2P1 | N2P2 | Water |
No. of Duckweeds | 0 | 0 | 0 | 11 | 0 | 0 | 0 | 0 | 5 |
Date | 12/10/05(Wednesday) Day 9 | ||||||||
Type of Fertilizer | N1 | N2 | P1 | P2 | N1P1 | N1P2 | N2P1 | N2P2 | Water |
No. of Duckweeds | 0 | 0 | 0 | 0 | 0 | 0 | 0 | 0 | 0 |
Date | 14/10/05(Friday) Day 10 | ||||||||
Type of Fertilizer | N1 | N2 | P1 | P2 | N1P1 | N1P2 | N2P1 | N2P2 | Water |
No. of Duckweeds | 0 | 0 | 0 | 0 | 0 | 0 | 0 | 0 | 0 |
Graphs
�
�
Evaluation:
Describe what you find out and say to what extent your results are both reliable and valid.
After I performed my experiment by using the tabular data to make a graph, I proved my hypothesis. As we can see from the tabulation, different concentration of different fertilizers affect the growth of the duckweeds, as stated by my hypothesis. For instance, P1, P2, and N1 are essential for the growth of the duckweeds but N2 is very harmful for their growth, and N2 mixed with any other fertilizer also decreases the number of Duckweeds. The plants containing water as their fertilizer have survived for a long period of time, which proves that water is essential for the growth of plants. Most of the plants increase in numbers and slowly start to die as we can see their growth and death rate in the graphs.
What I would do differently next time to improve the investigation is:
After I performed my experiment, I was reflecting and evaluating on my experiment. I even had to overcome some limitations and shortcomings while experimenting. If I were to do the experiment again, I would improve upon my analytical skills and would be more concentrated next time. My procedure of experimenting could be improved in many areas to make it more reliable. If I was to be more organized, my skills of experimenting would have been better. Overall, the basic idea in my method was correct and hence I could answer my research question respectively. In general, I used equipment precision and skills and paid close attention to safety. Most of us worked independently and I could surely modify my experiment by taking in account my mistakes and trying not to repeat them next time.
Bibliography:
en.wikipedia.org/wiki/Eutrophication
toxics.usgs.gov/definitions/eutrophication.html
www.umanitoba.ca/institutes/fisheries/eutro.html
www.eoearth.org/article/Eutrophication
Biology for IGCSE by Mary Jones
 canoeing sunday
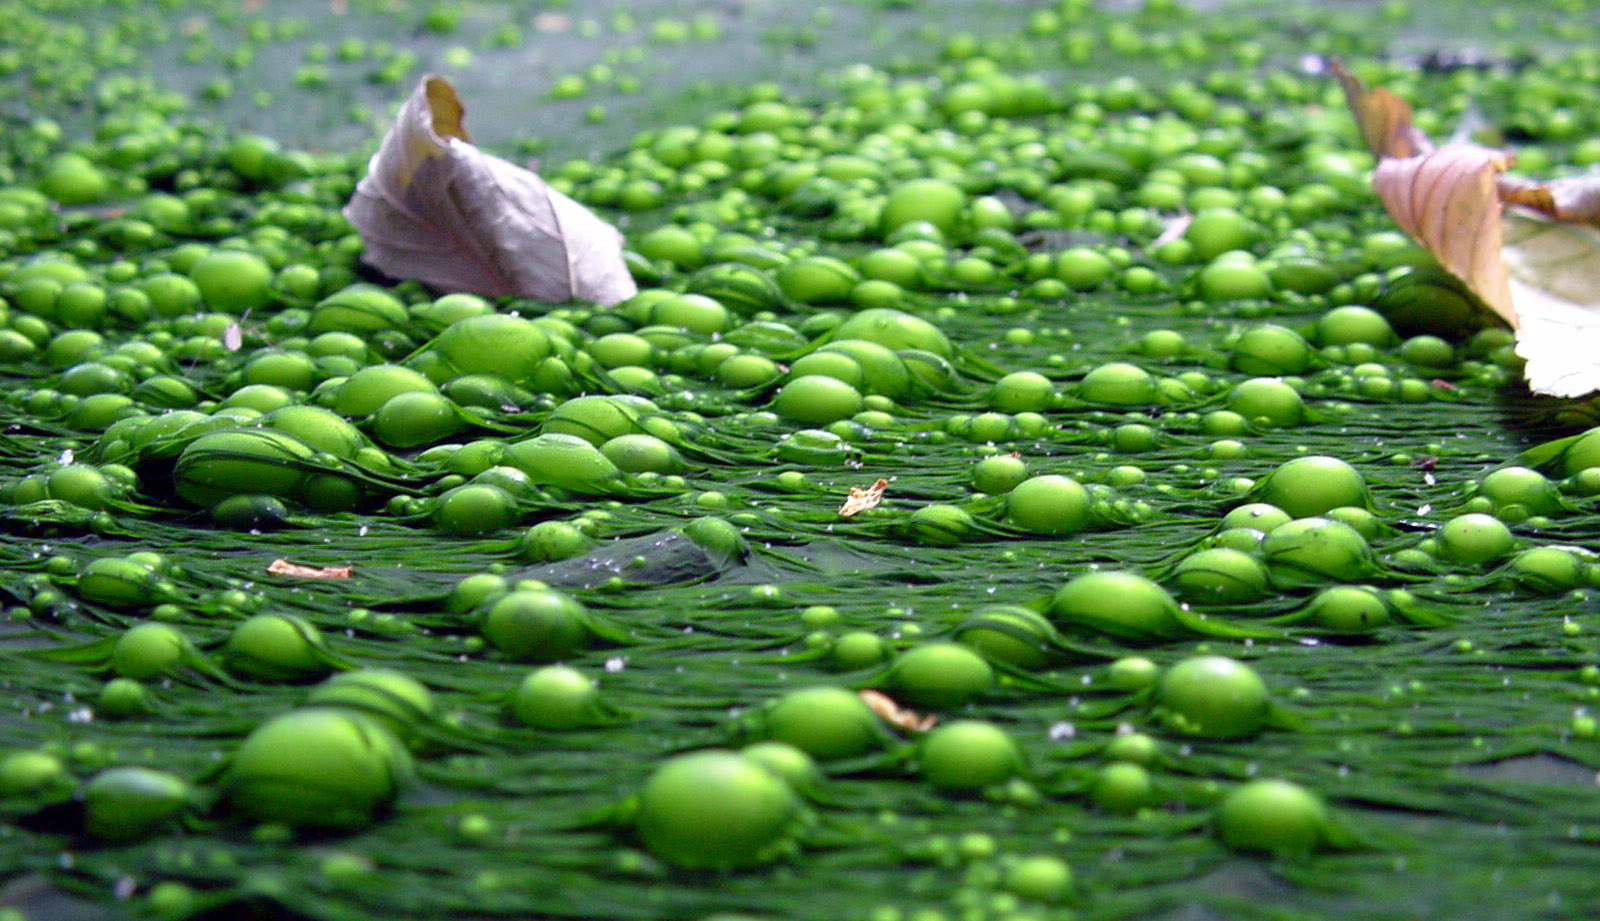 Eutrophication is caused by the enrichment of an e...