Effects of Salt and Water on Osmoregulation
Results
All students were required to void their urine at the start of the lab to use for the time zero data. The students selected to be in the NaCl group ingested a three gram NaCl tablet along with 500 mL of water. The remaining students who were in the water group ingested 500 mL of water at this time. The volume, level of pH, chloride concentration, and specific gravity of each urine sample was measured every thirty minutes, for a total of 120 minutes.
The results of the NaCl group compared to the water group showed significant differences when compared. The average urine volume for each group was largest at time zero; with the water group's mean volume at 101.3 mL and the NaCl group's mean volume at 129.3 mL (Figure 1). At the 60 minute interval the largest volume difference can be seen between each group (Figure 1).
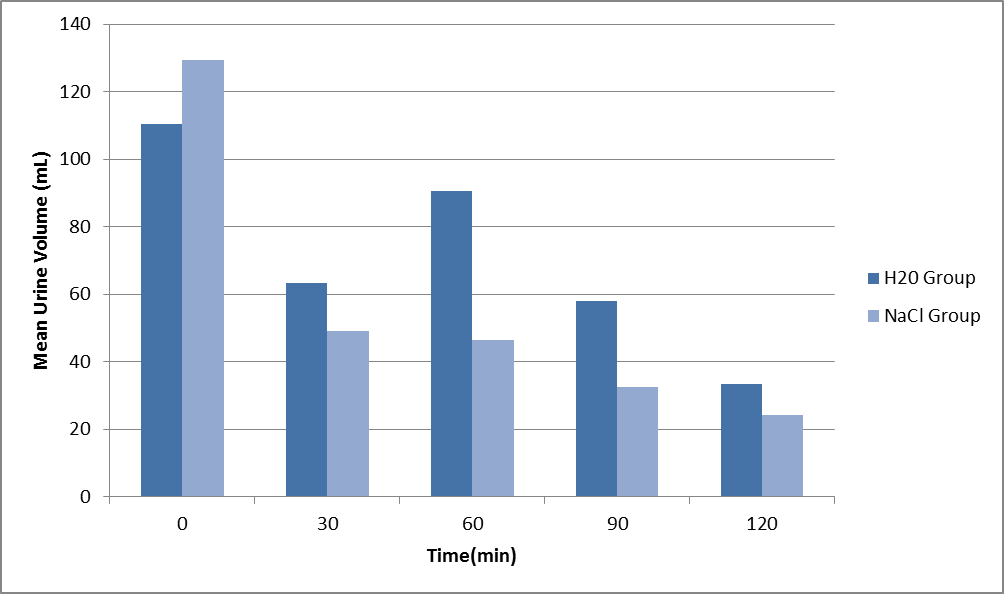 Figure 1
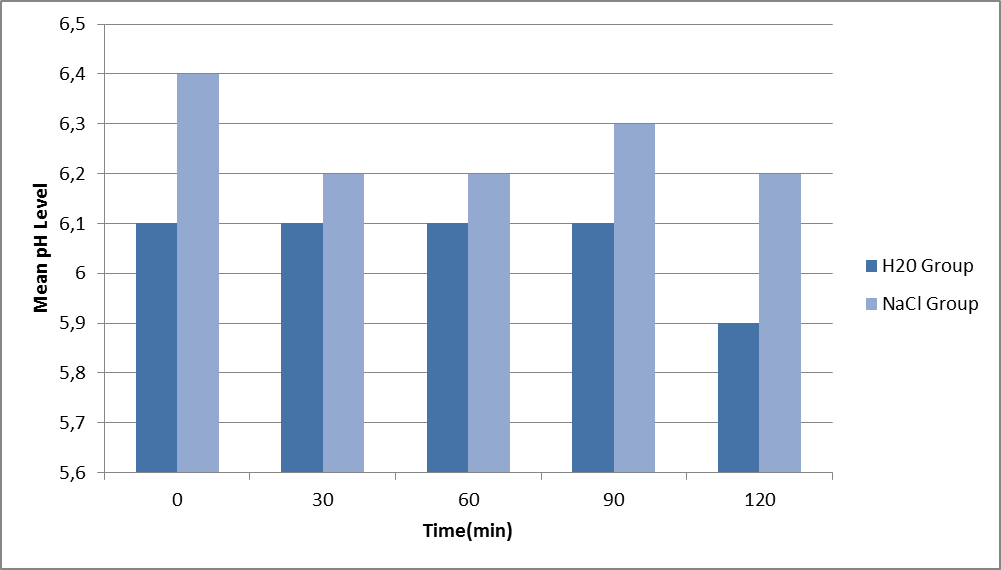 Figure 2
 Figure 3
As the experiment proceeded after time zero, the students who ingested the NaCl tablet produced less urine than the water group students for each remaining time interval. The final mean volume for the water group was 33.3 mL and the NaCl group was 24.1 mL (Figure 1).
The average pH level for the water group remained constant at 6.1 from time intervals zero through ninety, and dropped to 5.9 at 120 minutes (Figure 2). For the students who ingested NaCl, there initial pH level was at 6.4 for time zero, 6.2 for time thirty and sixty, 6.3 at ninety minutes, and finally dropping to 6.2 at the two hour mark (Figure 2). Each groups' pH values dropped 0.2 from the initial reading to the final reading. The NaCl group consistently provided a higher level of pH in their urine samples than...