1, what is the dependent variable in this demand study?
The number of commuter rides per week (WR) is the dependent variable.
2, what are the independent variables?
The price per ride (P), population in the metropolitan area served by MTA (POP), disposable income per capita (INC), and parking rate per hour (PARK) are independent variable.
3, what are the expected signs of the coefficients of the independent variables in forecasting demand?
The expected sign of the coefficients of the price is negative.
The expected sign of the coefficients of the population is positive.
The expected sign of the coefficients of the income is negative.
The expected sign of the coefficients of the park fee is positive.
4, using the regression analysis program in EXCEL estimate the coefficients of the independent variables using the data in Table 1.
5 provide an economic interpretation for the value of each of the estimated coefficients.
If P increase 1 cent, so WR will decrease 1,613.
 Description unavailable
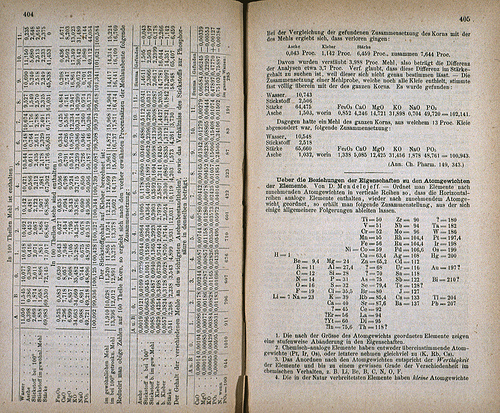 MENDELEEV, DMITRI IVANOVICH (1834 - 1907). Z. Chem...
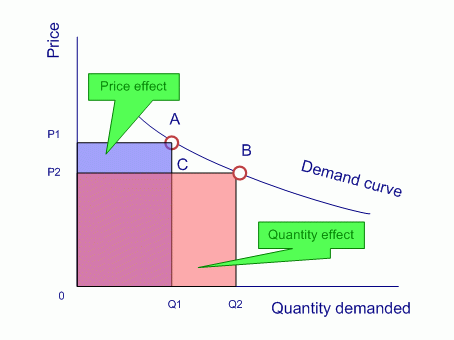 Graphical explanation of the total revenue test to...
If the POP increase 1 thousand, thw WR will increase 0.658. if the INC increase 1, the WR will decrease 0.04. if the PARK increase 1 cent, the WR will increase 1.94.
6, what is the coefficient of determination (R) and interpret the value? Are any coefficients statistically significant?
Coefficient of determination (R2 ) - 0.959009171
Coefficient of determination is a measure of how the overall estimating equation fits the data, which is within the range of 0 - 1. This shows the fraction of the variation in the Rider (WR) variable that is explained statistically by the four independent variables, which are population, income, price and parking. (Page 97)
All other coefficients are all statistically significant. However, the intercept coefficients are not statistically significant because the P-value is higher than 0.5, which is 0.876414995.
7 calculate...