Financial Ratio Analysis
Founded in 1986, Nautilus, Inc. began its journey of manufacturing, developing and marketing sports goods and fitness equipment. With products like ellipticals, benches, free weights, treadmills, bikes and many more strength and cardiovascular products, Nautilus has had its fair share of competitors because of the wide industry. However, with the development of the company over the years, Nautilus also sells products from other brands that include, Bowflex, Universal, Schwinn fitness, Peak Fit System and CoreBody Reformer. With all these products, Nautilus provides the education and tools to help people have a healthy lifestyle. As for their finances, the company has had their ups and downs. Within the last 5 years, they have shown inconsistencies in revenue but have improved dramatically in expenses to maintain a good profit. However, cutting costs and expenses will do that for a company and one number does not tell the whole story.
 Current Ratio - wzór
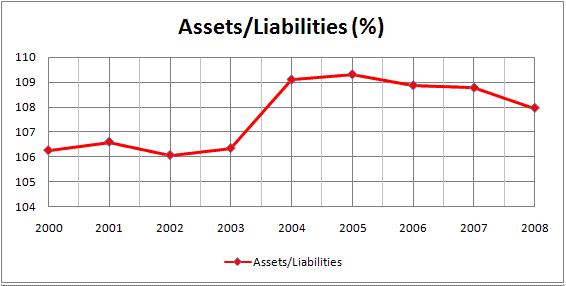 Asset/Liability Ratio
 The Wall Street Journal
Starting with Nautilus short-term liquidity numbers, the Current ratio is computed by current assets divided by current liabilities. As of 2011, their current ratio was 1.51 times, which is the second highest it has been the last 5 years ("businessweek.com," 2012). The table below shows the numbers of how this was computed and the comparison.
Year | 2007 | 2008 | 2009 | 2010 | 2011 |
Current Assets (thousands of dollars) | 276.7 | 126.7 | 77.3 | 51.6 | 58.1 |
Current Liabilities (millions of dollars) | 179.4 | 87.5 | 56.2 | 36.3 | 38.6 |
Current Ratio (times) | 276.7/179.4= 1.54 | 126.7/87.5= 1.45 | 77.3/56.2= 1.38 | 51.6/36.3= 1.42 | 58.1/38.6= 1.51 |
These numbers are shown to show how a company uses its cash and when looking at this, the higher the ratio, the better it is. Compared to one of their top competitors, Cybex International Inc., who has a 1.17 current ratio for 2011, Nautilus, is ahead of them in that category ("businessweek.com," 2012). With that being...