�
Table of Contents
31.0 Introduction �
32.0 Task 1: Stock Performance vs. market performance �
32.1 Comparison of Alufab stock performance with Market performance �
82.2 Ratio comparison for AluFab 2010 - 2011 ( Evaluation of the Financial Performance of the company �
92.3 Conclusion �
93.0 Task 2 - Capital Asset Pricing Model. �
93.1 The Relevance of the Capital Asset Pricing Model (CAPM) to investors �
113.2 CAPM Calculation �
123.2.1 Price per Share Calculation �
123.3 Conclusion �
134.0 Task 3 - Weighted Average Cost of Capital for Alufab �
134.1 Use of WACC and advantage over other models. �
144.2 Conclusion �
155.0 Task 4 - Performance Appraisal Methods �
155.1 Payback period calculation �
155.2 Net Present Value (NPV) �
155.3 Internal Rate of Return (IRR) �
165.4 Comparison of different types of Investment Appraisal methods �
17Table 4.4: Advantages of the various forms of Investment Appraisal �
 English: Metropolitan Life Bldg., Manhattan, New Y...
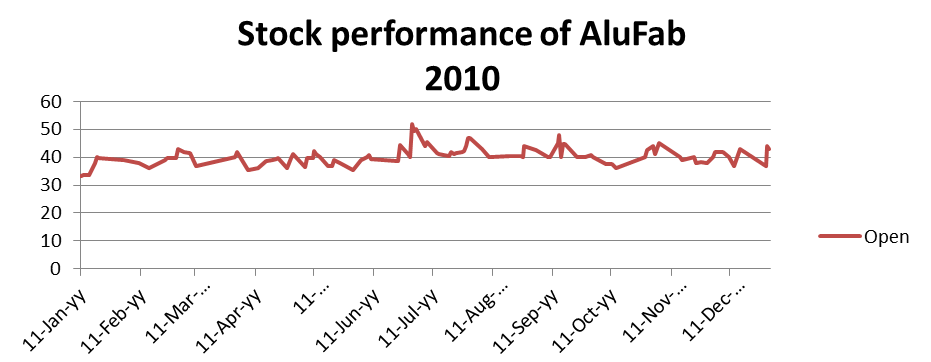 Figure 1
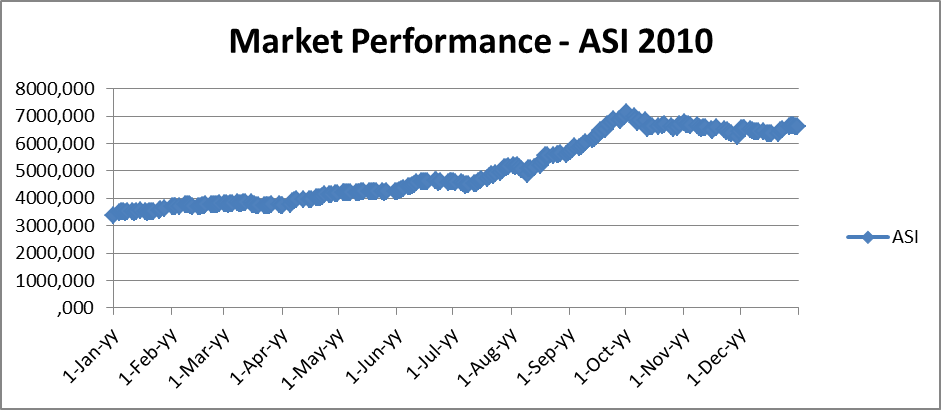 Figure 2
175.5 Conclusion �
186.0 Conclusion �
18The payback value for the particular scenario given was identified to be 3 years and 5 months. Also the Net Present Value of Rs.49299 is worthwhile with regard to the investment, therefore is able to carry out with the investment. �
197.0 References �
217.0 Appendices �
�
Fig1.1: Stock performance of Alufab - 2010â¦â¦â¦â¦â¦â¦â¦â¦â¦â¦â¦â¦â¦â¦â¦ | 2 |
Fig1.2: Market Performance (ASI - 2010)â¦â¦â¦â¦â¦â¦â¦â¦â¦â¦â¦â¦â¦â¦â¦â¦ | 3 |
Fig.1.3: Stock performance of Alufab 2011â¦â¦â¦â¦â¦â¦â¦â¦â¦â¦â¦â¦â¦â¦â¦.. | 4 |
Fig.1.4 : Market performance 2011â¦â¦â¦â¦â¦â¦â¦â¦â¦â¦â¦â¦â¦â¦â¦â¦â¦â¦â¦ | 5 |
Table 1.1: Comparison of Stock vs. Market performance 2010 - 2011â¦â¦â¦â¦â¦ | 5 |
Fig.1.5: Comparison of Stock vs. Market performance 2010 - 2011â¦â¦â¦â¦â¦â¦ | 6 |
Table 1.2: Ratio comparison of Alufab PLC 2010 -2011â¦â¦â¦â¦â¦â¦â¦â¦â¦â¦. | 6 |
Fig.2.1: CAPM Model with Security Market Line (SML) plottedâ¦â¦â¦â¦â¦â¦â¦ | 8 |
Table 2.1: Capital Asset Pricing model Calculationâ¦â¦â¦â¦â¦â¦â¦â¦â¦â¦â¦â¦. | 9 |
Table 2.2: Calculation of Price per Share of Alufab PLCâ¦â¦â¦â¦â¦â¦â¦â¦â¦â¦.. | 9 |
Table 3.1: Calculation of The Weighted Average Cost of Capitalâ¦â¦â¦â¦â¦â¦â¦. | 10 |
Table 4.1: Payback period Calculationâ¦â¦â¦â¦â¦â¦â¦â¦â¦â¦â¦â¦â¦â¦â¦â¦â¦â¦ | 11 |
Table 4.2: Net Present Value Calculationâ¦â¦â¦â¦â¦â¦â¦â¦â¦â¦â¦â¦â¦â¦â¦â¦â¦ | 12 |
Table 4.3: The Internal Rate of Return Calculationâ¦â¦â¦â¦â¦â¦â¦â¦â¦â¦â¦â¦â¦. | 12 |
Fig.4.4: Different Forms of Investment Appraisalâ¦â¦â¦â¦â¦â¦â¦â¦â¦â¦â¦â¦â¦.. | 13 |
Fig.4.5: Comparison of Investment Appraisal methodsâ¦â¦â¦â¦â¦â¦â¦â¦â¦â¦â¦.. | 13 |
Introduction
The following report consists of the coverage of four areas namely, investment evaluation, which is carried out by the comparison of the stock performance of Alufab - manufacturers and fabricators of Aluminium products, with the market performance, and also by the assessment of financial performance by the comparison of ratios over two years. The calculation of risk by the use of the Capital Asset Pricing Model (CAPM)is undertaken, where the price of a share of Alufab is also calculated by the use of the CAPM. Cost of Capital calculation by the use of Weighted Average Cost of Capital (WACC) and finally implications and description of various forms of investment appraisal methods is included in the body of the report.
Task 1: Stock Performance vs. market performance
2.1 Comparison of Alufab stock performance with Market performance
The stock prices fluctuate due to the forces prevailing in the market namely the demand and supply. Thus, the increase in the share price depends on the increase in demand while the increase in supply results due to the shareholders behaviour of selling the shares rather than buying them.
Hence, the stock performance for Alufab during the years 2010 and 2011 are compared with that of the market performance respectively for the two years, giving the probable reasoning for the results observed.
The lowest stock price of Alufab in the year 2010 was recorded on the 11th of January 2010, while it rose throughout the year with the highest price of Rs. 55 per share sold during the middle of the year and once again the prices showed a drastic drop once again but was always high with comparison to that of the first six months. It also should be noted that even though the company prices reduced after June 2010, the prices never lowered down to the lowest price of Rs.33 recorded for Alufab during the year 2010. The detailed performance of Alufab in year 2010 is attached in Appendix 1 of the report.
Fig2.2: Market Performance (ASI - 2010)
Alufab which is listed in the all Share Index (ASI) is thus compared with the market performance of year 2010. An instant look at the market performance data shows a vast difference in the range of values with that compared to those of Alufab. This difference is quite obvious as the market composes of all public companies in all sectors of industries spread out throughout the country.
Hence, as observed in fig.1.2 shown above the lowest price of Rs.3300 was recorded on the 1st of January 2010, which showed a constant increase until the 1st of October 2010 where it reached the largest price of Rs.7300, thereafter which the prices dropped down but those of which remained higher than the prices that were observed before October 2010.The entire open prices of the market in 2010 are listed down in Appendix 2 of the report.
Thus, in comparing Alufab's performance with the market performance it could be observed that when Alufab's performance was high (June 2010), the market performance was found to be low, while when the market performance was at its peak (October 2010) Alufab's performance was considerably low.
Fig.2.3: Stock performance of Alufab 2011
The highest market price of Alufab worth Rs.200 in the year 2011 was recorded on the 7th of May 2011, while the prices showed a drastic drop but was always high with comparison to the prices recorded before May 2011. Thereafter the prices once again rose which could be assumed to have resulted due to the increase in demand for the stock. The detailed performance of Alufab in year 2011 is attached in Appendix 3 of the report.
Fig.2.4 : Market performance 2011
Date | 2010 | ASI 2010 | 2011 | ASI 2011 |
12-Jan | 33.75 | 3,494.62 | 41 | 7,014.85 |
2-Feb | 39 | 3,709.13 | 55 | 7,262.26 |
1-Mar | 39.75 | 3,825.30 | 60 | 7,701.19 |
1-Apr | 42 | 3,746.50 | 60 | 7,377.22 |
6-May | 36.5 | 4,215.00 | 134.4 | 7,319.15 |
7-Jun | 40 | 4,431.32 | 141 | 7,294.54 |
8-Jul | 45.5 | 4,521.40 | 189 | 6,911.98 |
5-Aug | 43 | 5,137.38 | 138.3 | 6,751.29 |
13-Sep | 44.9 | 6,131.22 | 76 | 6,930.04 |
13-Oct | 36 | 51 | 6,585.99 | |
15-Nov | 40 | 6,507.21 | 38.1 | 6,092.30 |
16-Dec | 43 | 6,360.34 | 35.5 | 5,892.69 |
Table 1.1: Comparison of Stock vs. Market performance 2010 - 2011
Fig.2.4: Comparison of Stock vs. Market performance 2010 - 2011
The data shown both in the table and figure 1.4 shown above depicts the comparison between the stock performance of Alufab PLC compared against the market performance of years 2010 and 2011.
The data observed shows that Alufab's stock prices in 2011were considerably high with comparison to that of the prices observed in 2010. This was due to the increase in the gross profit of the company in year 2011 than in 2010, which lead to more investors purchasing shares from Alufab PLC. However, on the broad perspective, the increase of market performance has not enhanced the performance of Alufab, which there again reflects to the drop in profitability of Alufab which is furthermore supported by the financial performance of the organization which is evaluated by the comparison of ratios between 2010 and 2011.
2.2 Ratio comparison for AluFab 2010 - 2011 ( Evaluation of the Financial Performance of the company
AluFab PLC Accounting Ratios for the years ended 31st March | ||
2010 | 2011 | |
Profitability Ratios Return on Capital Employed (ROCE) (%) Gross Profit Margin (%) Operating Profit Margin (%) | 3.62 15.65 (28.3) | 3.51 19.5 2.81 |
Activity Ratios Sales revenue to capital employed (times) | 0.20 | 0.81 |
Liquidity Ratios Current Acid Test | 0.55:1 0.48:1 | 0.55:1 0.45:1 |
Capital Gearing Ratios Gearing | 0.50 | 0.43 |
Investors' ratios Earnings per share(Rs.) Price/earnings | (0.67) (10.9) | 0.39 |
Table 2.2: Ratio comparison of Alufab PLC 2010 -2011
The Return on the Capital Employed Ratio (ROCE) shows a slight drop in year 2010 than in 2011, which is not quite desirable. This outcome is mainly through the 4.1% increase in the gross profit margin which overcame a decrease in sales revenue to capital employed ratio. Hence, Alufab was more effective in making sales in year 2011 rather than in year 2010. The Operating Profit margin rose significantly from a negative value to a positive value due to the increase in the gross profit margin, despite the increase in the amounts spent on overheads.
The liquidity level remained the same over the two years showing somewhat an unhealthy situation for Alufab. The Acid Test Ratio showed an improvement in the liquidity levels of Alufab. Also, through the expanding reserves, the gearing ratio dropped slightly.
The increased profit with no increase in the number of share issues led directly to a vast increase in earnings per share ratio.
Thus the profit in 2010 reflected the future, rather than the prices, which were used in the calculation of that year's ratio.
Therefore, the business shows a slight improvement in most aspects of its performance and position over the year in 2011 than in 2010, since the gross profit and the EPS shows a considerable improvement in financial performance in 2011 than that in year 2010. It was more profitable, which led to strong cash flows in 2011 than in 2010 (Refer to Cash Flow statement of Appendix on pg.), and therefore, to much better liquidity and lower capital gearing in 2011 than in 2010.
2.3 Conclusion
As reflected by both the comparison of the stock vs. market performance and also by the financial performance of the evaluation of the ratios for Alufab PLC over 2010 - 2011, there is a considerable improvement shown in the financial status of the company in year 2011 rather than in year 2010, where year 2011 proved to be a promising year to Alufab with an increase in the share price and also with an increase in the Earning per Share ratio from a minus value in 2010 to a positive figure in 2011.
3.0 Task 2 - Capital Asset Pricing Model.
3.1 The Relevance of the Capital Asset Pricing Model (CAPM) to investors.
The Capital Asset Pricing Model (CAPM) uses various assumptions on markets and investor behaviour to set up unchangeable conditions that could be used to predict the return of an asset for a specific rate of risk.
Re = Rf + ÃÂ (Rm + Rf)
The above equation is the most commonly used form of CAPM, where ÃÂ is used as an appropriate measurement of risk for an asset as it provides with a means of measuring the asset's contribution to the risk of the market portfolio.
The CAPM provides with a means of determining the investment decision for the investors, by a Security Market Line (SML) which can be plotted based on the return - beta relationship of the market together by plotting an asset, the investor is able to determine whether the asset is either over or under - priced and make investment decisions based on the knowledge.
There are various assumptions that are made prior to implementing the CAPM as a tool for prospective investors in the stock market as follows:
Investors maximize expected utility of wealth.
Markets are frictionless-the borrowing rate is equal to the lending rate.
There are many investors, each with an endowment of wealth which is small compared to the total endowment of all investors (investors are price-takers).
All investors plan for one identical holding period.
There are no taxes or transaction costs
If an asset is overpriced it will lie below the SML as it will yield a lesser yield than what is determined by the SML at the given risk, while an underpriced asset will lie above the SML as it would provide with a greater return than what is determined by the SML.
Source: www.economics.fundamentalfinance.com
Fig.2.1: CAPM Model with Security Market Line (SML) plotted
3.2 CAPM Calculation
Capital Asset Pricing Model (CAPM = Er) | 0.3145 | ||||
Risk free Rate (Rf) | 0.1 | ||||
Beta (ÃÂ) | 2.86 | ||||
Market Return (Rm) | 0.175 |
Table 3.1: Capital Asset Pricing model Calculation
CAPM (Er) = Rf + ÃÂ (Rm - Rf)
= 0.3145 ÃÂ 100
= 30.14%
Rf = 10.75 (5 years data up to the 4th quarter ended in December 2011) - as per Central Bank Sri Lanka
ÃÂ = 2.86 (ASPI - Recent quarter details for Alufab as per the Colombo Stock Exchange)
Rm = 17.5% ( Calculated by the use of average closing prices of firms in the same industry)
3.2.1 Price per Share Calculation
Price of Share | Rs.12.2655 | ||||
CAPM | 30.14 | ||||
EPS (most recent - 2011) | 0.39 | ||||
Rs.11.754912 | |||||
Last traded price per share | 23.2 | ||||
Average price of shares traded in 2011 | 83.61 |
Table 3.2: Calculation of Price per Share of Alufab PLC
Assumption: The Earnings per share of 2011 (EPS) is assumed for the calculation of the Share Price in place of the dividends as no information of dividends are provided in the Annual Report of Alufab PLC. Also, the EPS does not show any growth over the years, therefore assumed to show a constant growth, as the EPS of 2010 also showed a loss.
EPS ÃÂ CAPM
= Rs.11.754912
Hence, as shown by the above calculations each share is sold at a loss with comparison to the last traded price and the average price of shares traded in 2011. This loss could be explained by the loss of price per share of Alufab in the 4th quarter of 2011, which could be observed in Fig.1.3 of page 3 of Task 1 of the report.
3.3 Conclusion
The CAPM takes into consideration the amount of risk involved within a business entity which helps in deciding if the company is open to a high or low return.
Hence, with consideration to Alufab PLC, the value arrived at by the implementation of the CAPM (30.14%) for 2011. This gives a somewhat healthy picture to the company. Also, the price of per share of Alufab in the fourth quarter of 2011 was found as Rs.11.75 which was lower than the average prices for 2011 which was explained to be due to the fall of stock prices during the last quarter of 2011.
4.0 Task 3 - Weighted Average Cost of Capital for Alufab
WACC = [Debt / (Debt + Equity)] ÃÂ Cost of Debt + [Equity / (Debt + Equity)] ÃÂ Cost of Equity
Weighted Average Cost of Capital (WACC) | ||||
Risk free (Rf) | 10.75 | |||
Beta | 2.86 | |||
Spread | 3 | |||
Income Taxes + Income before Taxes | 1838370 |
Calculation of WACC | 12.70171075 | |||
Cost of debt = Rf + Spread*( 1 - tax) | 12.7 | |||
Cost of equity = Rf + Beta * Rp | 31.45 | |||
Mkt. value of debt | 0 | |||
Mkt. value of equity | 100 | |||
Tax Rate | 0.35 |
Table 4.1: Calculation of The Weighted Average Cost of Capital
The Weighted Average Cost Of Capital (WACC) for Alufab is 12.7% found from the data provided by the Balance Sheet of the Annual Report 2011 of Alufab PLC.
4.1 Use of WACC and advantage over other models.
The weighted average cost of capital (WACC) is the rate of return a company's capital require, weighted according to the proportion each element bears in the total contribution of capital.
WACC is used in order to give companies an idea of their cost of financing, and acts as a measure to be minimized to find the best possible capital structure for the company.
The advantage of WACC over other measures to an organization is that it evaluates all forms of cost of capital and thereby is able to extract the most suitable form of capital, which the CAPM does not take into consideration.
4.2 Conclusion
The value of the WACC for Alufab found to be12.7% is quite favourable to Alufab and shows quite a favourable situation in terms of cost utilization of the company as Alufab does not have any long term debts, therefore has a capital which is more or less equity based, which gives rise to a favourable situation for Alufab PLC. On the other hand however the total liabilities of Alufab is quite high, as reflected by the company balance sheet, which would be of disadvantage to the company.
5.0 Task 4 - Performance Appraisal Methods
5.1 Payback period calculation
Year | Pay Cash Flow | Cumulative Cash Flow | |
0 | -Rs. 400,000.00 | -Rs. 400,000.00 | |
1 | Rs. 110,000.00 | Rs. 290,000.00 | |
2 | Rs. 120,000.00 | Rs. 170,000.00 | |
3 | Rs. 120,000.00 | Rs. 50,000.00 | |
4 | Rs. 120,000.00 | -Rs. 70,000.00 | (Exceeded) |
5 | Rs. 130,000.00 | ||
Payback period months calculation = (Rs.50,000/Rs.120,000)*12 =5 Months |
Table 5.1: Payback period Calculation
Pay back period= 3 years 5 months
5.2 Net Present Value (NPV)
Year | Cash inflow (Rs) | PV of 12.70% | PV of 12.70% in Cash flow (Rs) |
1 | Rs. 120,000.00 | 0.8873 | 106476 |
2 | Rs. 120,000.00 | 0.7873 | 94476 |
3 | Rs. 120,000.00 | 0.6986 | 83832 |
4 | Rs. 120,000.00 | 0.6199 | 74388 |
5 | Rs. 180,000.00 | 0.5500 | 99000 |
Total | 458172 | ||
Less - Investment (400000+(10000*0.8873)) | (408873) | ||
NPV | 49299 |
Table 5.2: Net Present Value Calculation
The investment is favourable and could be undertaken as the Net Present Value (NPV) is positive.
5.3 Internal Rate of Return (IRR)
The IRR is the rate of interest that makes the Net Present value = zero.
The Internal Rate of Return (IRR) is a form of appraisal commonly used to determine if a particular investment is worthwhile. An investment is considered to be worthwhile if the IRR is greater than the return of a similar investment opportunity.
5.3.1 Calculation of IRR
Year | Cash flow | 6% | PV @ 6% | 23% | PV @ 23% |
1 | Rs. 120,000.00 | 0.9434 | 113208 | 0.8130 | 97560 |
2 | Rs. 120,000.00 | 0.8900 | 106800 | 0.6610 | 79320 |
3 | Rs. 120,000.00 | 0.8396 | 100752 | 0.5374 | 64488 |
4 | Rs. 120,000.00 | 0.7921 | 95052 | 0.4369 | 52428 |
5 | Rs. 180,000.00 | 0.7473 | 134514 | 0.3552 | 42624 |
Total | 550326 | 336420 | |||
Less :- Investment | 400000 | 400000 | |||
150326 | (63580) |
Table 4.3: The Internal Rate of Return Calculation
IRR = i1 + NPV 1 / (NPV 1 - NPV 2) * (i1*i2)
IRR = 17.95%
The Internal Rate of Return for the particular project is 17.95% which is higher than the Weighted Average Cost of Capital of 12.70%, therefore, facilitating Alufab PLC to be able to incur costs until 17.95%, but at the point of exceeding this value, Alufab is not able to gain any profits therefore making the project worthless.
5.4 Comparison of different types of Investment Appraisal methods
Investment appraisal is all about assessing these income streams against the cost of the investment.
The various types of Investment Appraisal are as shown in Fig.4.1 shown above, which includes the Net Present Value (NPV), Cash Flows, Probability Index, the Internal Rate of Return (IRR) and the Accounting Rate of Return ARR).
The advantages and disadvantages of each form of appraisal is described in detail in Fig.4.2 shown below:
Form of Investment Appraisal | Advantages | Disadvantages |
Net Present Value | Simple to use Useful for short term decision making Useful if the returns are accurate | Ignores the timing of cash flows within the payback period. |
Payback method | It measures the length of time it takes a project to repay its initial cost of capital. The most easiest form of Investment Appraisal method | Does not take account of the profits gained by the project. Based on accounting profits rather than on cash flows |
Cash Flows | Yields from investment, Profitability vs. risk | Does not take the accounting profits into account |
Probability Index | Gives a relative idea of how well the project would perform giving an overall picture | Does not give the most appropriate decision when considering mutually exclusive projects. |
Internal Rate of Return | Takes account of changing value of money over time | Ignores the relative size of investments |
Accounting Rate of Return | Shows profitability Allows comparison between projects | Takes no account of the length of project |
Table 4.4: Advantages of the various forms of Investment Appraisal
5.5 Conclusion
The payback value for the particular scenario given was identified to be 3 years and 5 months. Also the Net Present Value of Rs.49299 is worthwhile with regard to the investment, therefore is able to carry out with the investment.
6.0 Conclusion
The stock prices fluctuate due to the forces prevailing in the market namely the demand and supply. Thus, the increase in the share price depends on the increase in demand while the increase in supply results due to the shareholders behaviour of selling the shares rather than buying them.
Reflected by both the comparison of the stock vs. market performance and also by the financial performance of the evaluation of the ratios for Alufab PLC over 2010 - 2011, there is a considerable improvement shown in the financial status of the company in year 2011 rather than in year 2010, where year 2011 proved to be a promising year to Alufab with an increase in the share price and also with an increase in the Earning per Share ratio from a minus value in 2010 to a positive figure in 2011.
The CAPM takes into consideration the amount of risk involved within a business entity which helps in deciding if the company is open to a high or low return.
Hence, with consideration to Alufab PLC, the value arrived at by the implementation of the CAPM (30.14%) for 2011. This gives a somewhat healthy picture to the company. Also, the price of per share of Alufab in the fourth quarter of 2011 was found as Rs.11.75 which was lower than the average prices for 2011 which was explained to be due to the fall of stock prices during the last quarter of 2011.
The value of the WACC for Alufab found to be12.7% is quite favourable to Alufab and shows quite a favourable situation in terms of cost utilization of the company as Alufab does not have any long term debts, therefore has a capital which is more or less equity based, which gives rise to a favourable situation for Alufab PLC. On the other hand however the total liabilities of Alufab is quite high, as reflected by the company balance sheet, which would be of disadvantage to the company.
The payback value for the particular scenario given was identified to be 3 years and 5 months. Also the Net Present Value of Rs.49299 is worthwhile with regard to the investment, therefore is able to carry out with the investment.
7.0 References
Unknown, 2011, "Beta Values for Alufab PLC", [online], Available at:http://www.cse.lk/welcome.htm, [Retrieved on: 23 - 03- 2012]
Unknown, 2011, "Treasury Bonds", [online], Available at: http://www.cbsl.gov.lk/htm/english/_cei/ir/i_3.asp, [Retreived: 25 - 03 - 2012]
Unknown, 2010, " Investment Appraisal Forms", [online], Available at:http://financial.kaplan.co.uk/Documents/ICAEW/MI_Ch3_p.pdf, [Retreived: 26 - 03 - 2012]
Unknown, 1999, "Internal Rate of Return", [online], Available at:http://www.solutionmatrix.com/internal-rate-of-return.html [Retreived:27 - 03 - 2012)
Unknown, 1998, "Capital Asset Pricing Model", [online], Available at: http://economics.fundamentalfinance.com/capm.php [Retreived:28 - 03 - 2012]
8.0 Appendices
Rf
SML
Rm
Re
ÃÂm = 1
ÃÂ
�