Finding and Analyzing Principal components of protein consumption
From different food sources
In European Countries
ABSTRACT
The data set contains Protein consumption (g per person per day) in 25 European countries. Here we
Measure the consumption of protein using 9 different food items for all 25 countries.
Here we consider Read meat, White meat, Eggs, Milk, Cereals, Starchy foods, Pulses/nuts and oilseeds, Fruits and vegetables as our 9 different food items.
Using those food items (variables) we try to understand the behavior of this data set and then we can predict conclusions.
Using principal component Analysis we try to simplify this data set and from it we can make predictions easily.
Here we only try to simplify this data using principal component analysis and make some conclusions based on that.
CONTENTS
�
ACKNOWLEDGEMENT ii
ABSTRACT ii
CONTENTS iii
LIST OF TABLES iv
LIST OF FIGURES v
1. INTRODUCTION 1
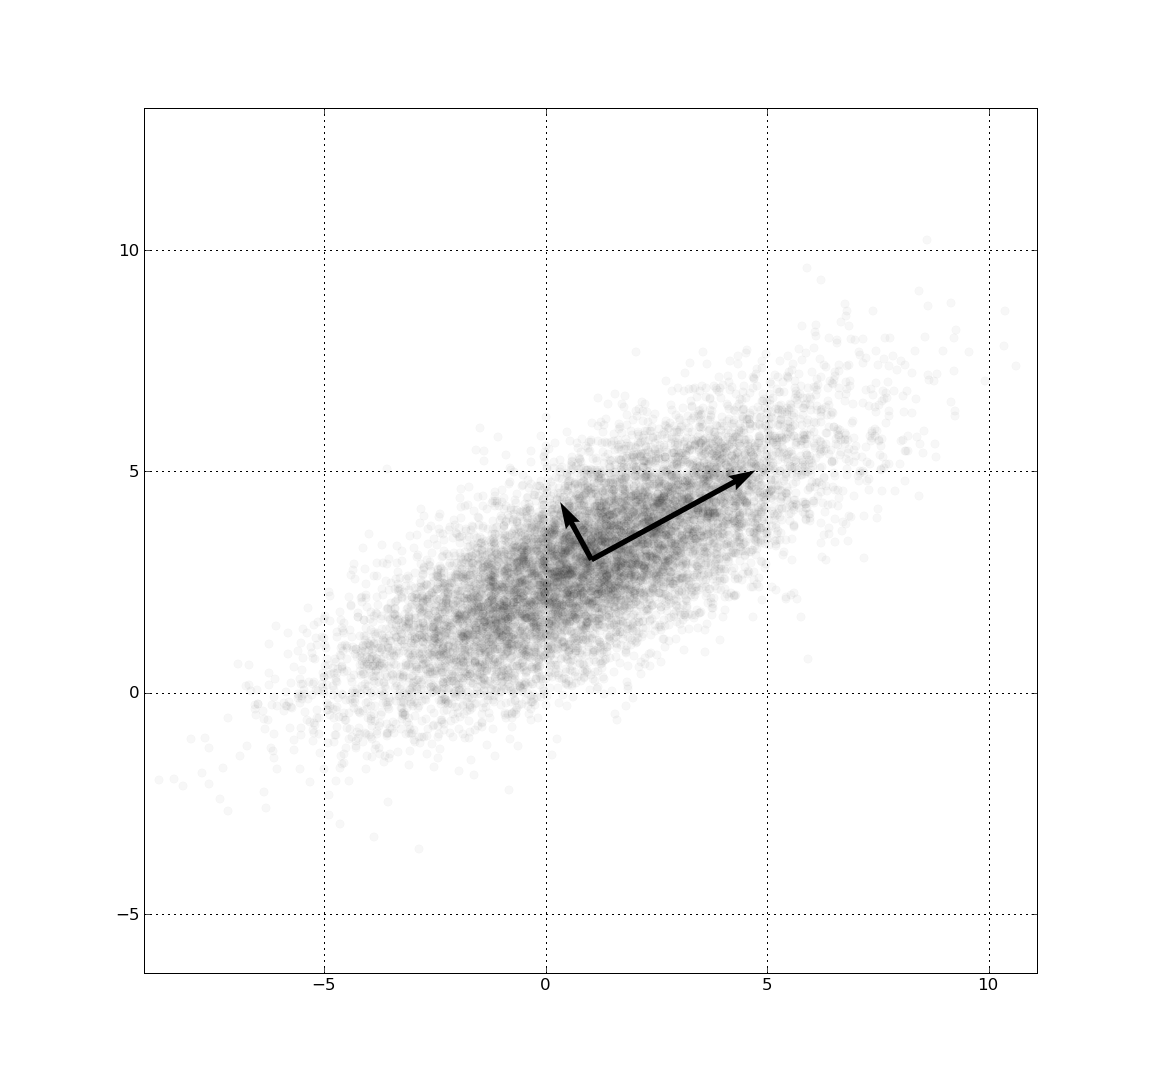 PCA of a multivariate Gaussian distribution center...
 Protein Wisdom
 Eight Passion Proteins With Care
2. METHODOLOGY 2
3. ANALYSIS AND INTERPRETATION 3
4. OVERALL CONCLUSION 15
5. REFERENCES 16
6. APPENDIX 17���
LIST OF TABLES
Table 3.1 - Descriptive Statistics â¦â¦â¦â¦â¦â¦â¦â¦â¦â¦â¦â¦â¦â¦â¦â¦â¦â¦â¦â¦.â¦â¦..â¦Page 03
Table 3.2 - Correlation Coefficients between the variablesâ¦â¦â¦â¦â¦â¦â¦â¦â¦â¦â¦...â¦â¦.Page 14
Table 3.3 - Summary (Model One - full model)â¦â¦â¦â¦â¦.â¦â¦â¦â¦â¦â¦â¦â¦â¦..â¦â¦â¦.Page 15
Table 3.4 - Summary (Model One - reduced model I)â¦â¦â¦â¦â¦â¦â¦â¦â¦.â¦â¦â¦â¦â¦â¦..Page 17
Table 3.5 - Summary (Model One - reduced model II)â¦â¦â¦â¦â¦â¦â¦â¦â¦.â¦â¦â¦â¦.........Page 18
Table 3.6 - Model One - beta valuesâ¦â¦â¦â¦...â¦â¦â¦â¦â¦â¦â¦â¦â¦â¦â¦â¦â¦â¦â¦â¦â¦...Page 19
Table 3.7 - Summary (Model Two - full model)â¦â¦â¦â¦â¦.â¦â¦â¦â¦â¦â¦â¦â¦â¦â¦..â¦â¦.Page 20
Table 3.8 - Summary (Model Two - reduced model I)â¦â¦â¦â¦â¦â¦â¦â¦â¦.â¦â¦â¦â¦â¦â¦.Page 21
Table 3.9 - Model Two - beta valuesâ¦â¦â¦â¦...â¦â¦â¦â¦â¦â¦â¦â¦â¦â¦â¦â¦â¦â¦â¦â¦â¦...Page 22
Table 3.10 - P-Values for normality testsâ¦â¦â¦â¦...â¦â¦..â¦â¦â¦â¦â¦â¦â¦â¦â¦â¦...â¦â¦...Page 23
LIST OF FIGURES
Figure 3.1 - Histogramsâ¦â¦â¦â¦â¦â¦â¦â¦â¦â¦â¦â¦â¦..â¦â¦â¦â¦â¦â¦â¦â¦â¦â¦â¦â¦â¦â¦.Page 05
Figure 3.2 - Box Plotsâ¦â¦â¦â¦â¦â¦â¦â¦â¦â¦â¦â¦â¦â¦â¦â¦â¦.â¦â¦â¦â¦â¦â¦â¦â¦â¦â¦....Page 08
Figure 3.3 - Q-Q Plots with Q-Q Lineâ¦â¦â¦â¦â¦â¦â¦â¦â¦â¦â¦â¦â¦â¦.â¦â¦â¦â¦â¦â¦â¦...Page 11
�
1. INTRODUCTION
The term "Protein consumption" means the amount of protein...