Gantt Chart
Introduction.
A Gantt chart is a visual project management tool first developed and used by Henry Gantt during World War I. Gantt charts, also known as bar charts, time lines, or milestone charts are one of the most popular and useable ways to present project information.
The parts of a Gantt chart.
A Gantt chart lists tasks or phases of a project from top to bottom and has time running from left to right. Each task has a start date and duration (or end date). Planned tasks are usually drawn as open bars, which are filled in as the work is done. Alternatively separate filled in bars can be drawn below the open bars to more clearly show how the tasks are proceeding in relation to their planned schedule. Additionally, a Gantt chart may show the resources required for a particular task as well as project milestones and/or task interdependencies.
 English: A project plan gantt chart implementation...
 A Gantt chart created using Microsoft Project (MSP...
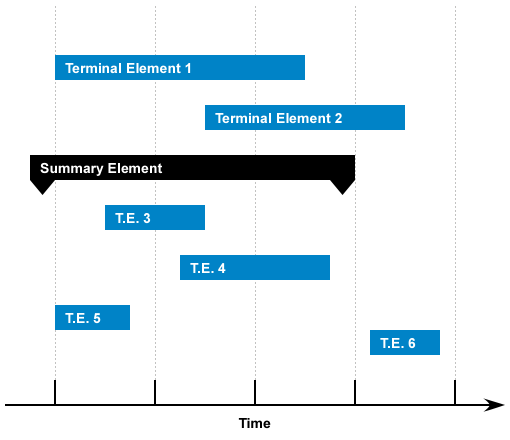 Gantt-chart
Advantages and disadvantages.
Some of the advantages of Gantt charts are that they are simple and visual. It is relatively easy to explain a Gantt chart even to those who have never seen one before. Because of this simplicity, Gantt charts are used in both large and small projects. However, large or complex projects may demand more sophisticated methods in addition to Gantt charts. Another problem with Gantt charts is that it may be difficult to determine how a complex series of tasks interrelate. It does not show the delay on some elements. It does not give a clear indication of interdependence of the various activities. It does not gives the planner what activities must be completed on schedule to ensure the project completed as planned. Also does not gives the planner how much an activity may be delay without influencing the start of another activities.
Other project...
Comment
If an attachment of the Gantt chart was included , it would be much more useful!
0 out of 0 people found this comment useful.