Return on capital employed =Net profit percentage =Gross Profit percentage =Asset turnover = timesFixed Asset turnover = timesStock turnover period = daysDebtor's collection Period = daysCreditors payment period = daysCurrent Ratio = timesLiquidity Ratio =Gearing =Interest cover = timesEarning per share = ã2,125/per shareDividend Yield =Dividend Cover = timesPrice Earning Ratio =Return on Equity =Return on Capital Employed: Profit calculated before interest and tax, divided by the difference between total assets and current liabilities. The ratio calculated shows the expansion that capital generates revenue (http://www.investorwords.com/5770/Return_on_Capital_Employed.html).
The ROCE ratio, expressed as a percentage, implements the return on equity (ROE) ratio, which adds to company's debt liabilities, the company's total capital employed. By this a company can better investigate their ability to generate returns from their capital (http://www.investopedia.com/university/ratios/profitability-indicator/ratio5.asp).
Investors can enquire how profitable a company is by comparing net income to the sum of a company's debt and equity capital. The ROCE measurement is an all inclusive method to check over the profitability of a company because it can estimate the ability that a manager has for producing (http://www.investopedia.com/terms/r/roce.asp).
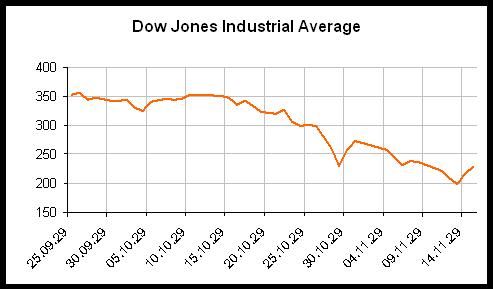 DJ industrial average 1929 Black Friday
![[sYs] Safari Collection for TLC](/uploads/14/149560/sys-safari-collection-tlc.jpg) [sYs] Safari Collection for TLC
[sYs] Safari Collection for TLC![[sYs] :::: IT'S MY STYLE Contest **NOW CLOSED**](/uploads/14/149560/sys-s-my-style-contest-now-closed.jpg) [sYs] :::: IT'S MY STYLE Contest **NOW CLOSED**
[sYs] :::: IT'S MY STYLE Contest **NOW CLOSED**The average ratio is 25% and the SYS is 28,57%. 3,57% higher. That means that the company is more efficient than the industrial average. The SYS plc can raise more funds to company and also acquire better management.
Net profit percentage. Expressed as a percentage of sales revenue (http://www.encyclopedia.com/doc/1O18-netprofitpercentage.html) . The industrial average is 35% but the SYS is 28,3% lower by 6,7% . That declares lower competitors prises and lower margins of safety.
Gross Profit Percentage: Is a ratio which show which is the profit when all the variable costs are subtracted from the revenues. When the gross profit is expressed as a percentage of sales is the ratio of financial presentation (http://www.encyclopedia.com/doc/1O18-grossprofitpercentage.html). By this way a company can measure its trading success.
With a 65% of gross profit percentage in industrial average, we can understand that there is a controlled management. On the other hand, the 60% in gross profit in SYS plc it saws that probably there are high expenses or the management is not so good controlled, so it should be decreases the prices.
Asset turnover: It measures the company's efficiency to use its asset in order to generate sales. As higher that number is so better for the company (http://www.investopedia.com/terms/a/assetturnover.asp).
SYS plc has a little bit higher asset turnover than the industrial average. That shows that there is a higher profit on margin.
Fixed asset turnover: measure's how efficient is a company to generate net sales revenue from fixed-asset investments (http://www.investopedia.com/terms/f/fixed-asset-turnover.asp). SYS's plc fixed assets are a little higher than the industrial average. That means that SYS's plc investment is more effective in net property, plant, and equipment (http://www.spireframe.com/docs/financial_ratio_fixed_asset_turnover.aspx).
Stock turnover period: present how quickly a company is turning over stock.
SYS plc has very high stock turnover period in comparison with the industrial average. That probably means that SYS plc has better stock demand and management than industrial average.
Debtors' Collection Period: The period which a company has to wait until starts to collect the money that trade debtors owe to it (http://www.encyclopedia.com/doc/1O18-debtorcollectionperiod.html). SYS plc do this in 61 days. Almost the double days than the industrial average has. That indicates that the company is not as profitable as the industry average.
Creditors Payment Period: Is the period which the company pays the creditors. This includes the bills too (http://www.accountingformanagement.com/creditors_payable_turnover_ratio.htm) .
SYS plc is taken 98 days to pay and Industrial average 48 days. This may happen because there is not enough money due to are not paid from the customers or the revenues are not enough.
Current Ratio: measures if company can pay its short-term responsibilities. It is used to show if the company has the ability to pay back his short-term liabilities. As high the current ratio is so accomplished is the company to pay. When the ratio is less than 1 it means that the company can not pay its obligations (http://www.investopedia.com/terms/c/currentratio.asp).
SYS plc is higher than Industrial average. SYS plc is more capable to pay of its obligations than the industrial average, and is in good financial healthLiquidity Ratio: It measures a company's ability to pay off its cash. The higher the value of the ratio, the larger the margin of safety is (http://www.investopedia.com/terms/l/liquidityratios.asp).. If the value is greater than 1.00, it means fully covered. SYS plc is lower than industrial average but is greater than 1.00 which means full cover.
Gearing: measures the level in which company's activities are funded by its capital versus creditor's funds (http://www.investopedia.com/terms/g/gearingratio.asp). Industrial average which is in 35% is riskier than SYS plc which has 26%. Industrial average is in danger because it has to continue debt whereas the sales are bad.
Interest Cover: Measures how easily a firm can pay interest on outstanding debt (http://www.investopedia.com/terms/i/interestcoverageratio.asp).
Industrials' average is lower than SYS plc. It means that SYS plc is not aggravates by debt expenses as much as Industrial average does.
Earning per share: shows the companies profitability. This is the most important variable to the share's price determination (http://www.investopedia.com/terms/e/eps.asp). SYS plc is lower than Industrial Average. This may happened because the net incomes should be lower than Industrial average or it could use its capital to generate income.
Dividend Yield: it measures how much cash the company gets for every dollar which invested in an equity position. It is the return the company gets from a stock (http://www.investopedia.com/terms/d/dividendyield.asp). SYS plc gets less dividend yield than Industrial. This may happen because of the low investment of SYS plc or because is a young company.
Dividend Cover: shows if a business can pay easily its dividend from profit (http://www.bized.co.uk/compfact/ratios/investor10.htm). SYS plc is 3,5 times higher than the Industrial Average. That means that the company has the funds for paying the dividend.
Price Earnings Ratio: measures the expensiveness of a stock. As long as the price earning ratio is, so much the earnings growth will be in the future (http://www.investopedia.com/terms/p/price-earningsratio.asp).SYS's plc Price earning ratios in much lower than Industrials average. For an investor is not a very good movement to invest in this company because there is a big difference between this and the industrial average.
Return on Equity: measures the profit that a company generates with the investor's money (http://www.investopedia.com/terms/r/returnonequity.asp). SYS's plc is much lower than Industrial average. That means that the profit which gets from the investors is not as high as industrial average.
Ratio analysis has many advantages. In spite of them we should keep in mind that there are certain limitations and should be kept in mind. These are:Different Accounting Policies: Every company can choose a different accounting policy. That is possible to deform the comparisons between the companies. The business may choose not to revalue its asset because if it doing this the depreciation will be high and profit is going to be low. Creative accounting : The businesses presents the financial performance by accounting. Ratios are not definitive measures: Ratios has to be construing carefully because they are shown to company the financial situation without shown if the performance is good or not. Outdated information in financial statement: Some time the information a company takes from the account are out of date, and for this reason it's not always represented the right financial position.
Historical costs not suitable for decision making: When the companies use historical cost of accounting, the asset valuation in balance sheet could be confusing. Ratios which based on this information are not very useful when the company wants to make a decision. Financial statements certain summarised information: Accounting records are summarized financial statements which are based ratios. There is information which shows a wrong result at the end of the year. Interpretation of the ratio: Most of the times a company can not realise if a particular rate is good or bad. Price changes: The inflation will not be in the same levels of purchasing force. Changes in results over time may show as if the enterprise has improved its performance and position when in fact after adjusting for inflationary changes it will show the different picture. Technology changes: By the comparison, performance has to be in the same line with the technology level. For ratios the company should compare its results with another of the same level of technology. Changes in accounting policy: If the company changes the accounting policy it used to have, the results will be confused. Nevertheless, director may change the results in order to change the accounting policy, and avoid the effects which probably have an old accounting policy or grow the effects of a new one.
Changes in Accounting standard: If there is a change in accounting standards this will be affect in company's report for many years because the accounting standards presenting the financial transactions with a special way. Impact of seasons on trading: The financial statement do not have to based on years end but the company should choose the best season for this in order to have the true results. Different financial and business risk profile: By using only ratios to compare two companies there is possibility to get wrong information. There are no companies who have the same report even if they are competitors in the same market. They may have different facts such us business risk. Different capital structures and size: If a company is all equity financed and another is geared they have different capital structures, and the analysis may not be good. Impact of Government influence: Companies with the same line of business may have different government incentive. If it is compared the refund of these companies the results may be confused. Window dressing: These techniques applied by way of showing a strong financial position (http://cbdd.wsu.edu/kewlcontent/cdoutput/TOM505/page26.htm).
BIBLIOGRAPHYANZ New Zealand, 1997-2009. Calculators. [Online]Available at: http://www.anz.co.nz/calc/busfintools/stock_turnover.asp[Accessed 1 December 2009].
Bized, 2009. Dividend Cover [Online] Available at: http://www.bized.co.uk/compfact/ratios/investor10.htm [Accessed 2 December 2009].
Encyclopedia, 2009. Net profit percentage [Online] Available at: http://www.encyclopedia.com/doc/1O18-netprofitpercentage.html [Accessed 3 December 2009].
Encyclopedia, 2009. gross profit percentage [Online] Available at: http://www.encyclopedia.com/doc/1O18-grossprofitpercentage.html [Accessed 1 December 2009].
Encyclopedia, 2009. gross profit percentage [Online] Available at: http://www.encyclopedia.com/doc/1O18-grossprofitpercentage.html [Accessed 1 December 2009].
Encyclopedia, 2009. debtor collection period [Online] Available at: http://www.encyclopedia.com/doc/1O18-debtorcollectionperiod.html [Accessed 1 December 2009].
Investopedia, 2009. Asset Turnover. [Online] Available at: http://www.investopedia.com/terms/a/assetturnover.asp [Accessed 2 December 2009].
Investopedia, 2009. Fixed-Asset Turnover Ratio. [Online] Available at: http://www.investopedia.com/terms/f/fixed-asset-turnover.asp [Accessed 26 November 2009].
Investopedia, 2009. Profitability Indicator Ratios. [Online] Available at:http://www.investorwords.com/5770/Return_on_Capital_Employed.html[Accessed 30 November 2009].
Investopedia, 2009. Return On Capital Employed - ROCE. [Online] Available at: http://www.investopedia.com/terms/r/roce.asp [Accessed 28 November 2009].
Investopedia, 2009. Current ratio. [Online] Available at:http://www.investopedia.com/terms/c/currentratio.asp[Accessed 28 November 2009].
Investopedia, 2009. Liquidity Ratios. [Online] Available at:http://www.investopedia.com/terms/l/liquidityratios.asp [Accessed 1 December 2009].
Investopedia, 2009. Gearing Ratio.[Online] Available at: http://www.investopedia.com/terms/g/gearingratio.asp [Accessed 2 December 2009].
Investopedia, 2009. Interest Cover Ratio.[Online] Available at: http://www.investopedia.com/terms/i/interestcoverageratio.asp[Accessed 2 December 2009].
Investopedia, 2009. Earnings Per Share - EPS.[Online] Available at: http://www.investopedia.com/terms/e/eps.asp [Accessed 3 December 2009].
Investopedia, 2009. Dividend Yield [Online] Available at: http://www.investopedia.com/terms/d/dividendyield.asp [Accessed 26 November 2009].
Investopedia, 2009. Price-Earnings Ratio - P/E Ratio [Online] Available at: http://www.investopedia.com/terms/p/price-earningsratio.asp [Accessed 26 November 2009].
Investopedia, 2009. Return On Equity - ROE [Online] Available at: http://www.investopedia.com/terms/r/returnonequity.asp [Accessed 26 November 2009].
InvestWords.com, 2009. Return on Capital Employed. [Online] Available at: http://www.investorwords.com/5770/Return_on_Capital_Employed.html[Accessed 1 December 2009].
NetTOM, Session 15: Limitation of Ratio Analysis . [Online] Available at: http://cbdd.wsu.edu/kewlcontent/cdoutput/TOM505/page26.htm [Accessed 2 December 2009].
Spireframe software, 2003-2009. Financial Ratio Definition. [Online] Available at: http://www.spireframe.com/docs/financial_ratio_fixed_asset_turnover.aspx[Accessed 25 November 2009].
Welcome to accounting for management, 2009. Creditors / Accounts Payable Turnover Ratio. [Online] Available at: http://www.accountingformanagement.com/creditors_payable_turnover_ratio.htm [Accessed 2 December 2009].
![[sYs] at GOL](/uploads/14/149560/sys-gol.jpg) [sYs] at GOL
[sYs] at GOL![[sYs] Opening Celebration](/uploads/14/149560/sys-opening-celebration.jpg) [sYs] Opening Celebration
[sYs] Opening Celebration![[sYs] Salome Necklace](/uploads/14/149560/sys-salome-necklace.jpg) [sYs] Salome Necklace
[sYs] Salome Necklace