BAO3403 INVESTMENTS AND PORTFOLIO MANAGEMENT
Group members:
Liu Tianyi ID: 3750862
Zhao Xin ID: 3749501
Zhao Xin ID: 3750850
�
Summary
In this report, three companies which are listed on the Australian Stock Exchange are chosen: Woolworths Ltd., Lion Nathan Ltd. And Super Cheap Auto Group Ltd.. This report will be divided into three sections. In the first section, the company's historical share price will be downloaded on the website, and the price trend, required return and dividend growth will be calculated and represented in a chart. In the second section, the story of company will be introduced. It includes the information which can influent the investors decision, such as, director's statements, media releases and corporate governance etc.. In the third section, the conclusion will be made through the comparison of the three companies, and an allocation will be justified if we currently have $10,000 to invest.
�
Suggested Report
1.0 THE NUMBERS
1. 1 Trend in Monthly Share Prices
The date in Appendix 1 (Table 1) describes the adj.
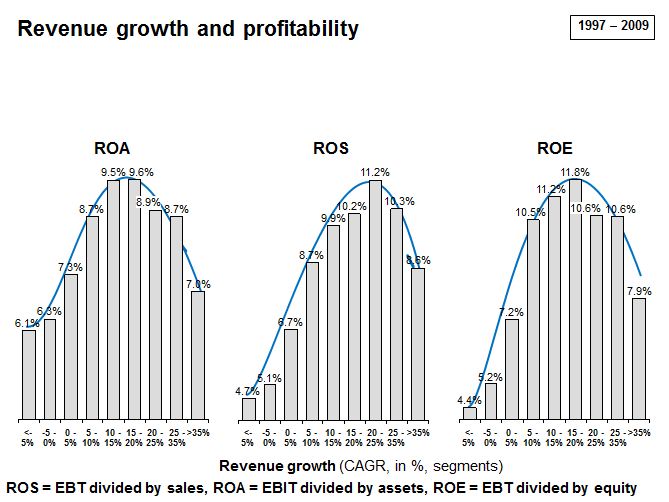 English: Revenue growth and profitability
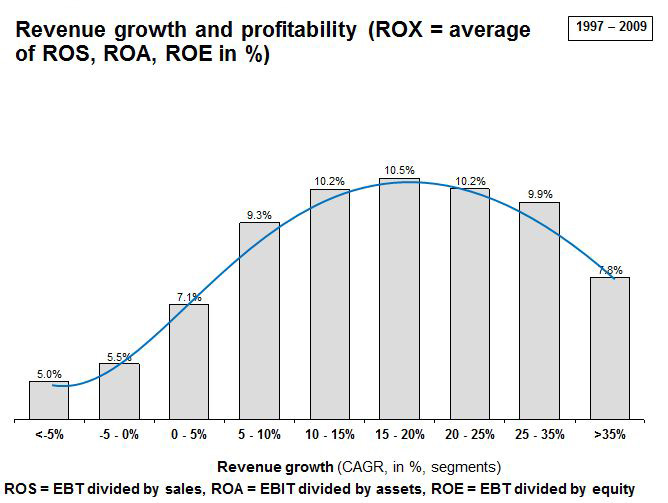 English: Revenue growth and profitability (ROX)
 Conoscere gente sul treno: il grande senegalese + ...
close and returns of the three companies from 1 April 2004 and 1 April 2009 in monthly and the Squared Deviation of the date is pointed out.
In Figure 1,2&3 of the three line charts show monthly share prices and returns in the same period.
�
Figure 1
�
Figure 2
�
Figure 3
This is the form of price and return of WOW. The price of WOW registers as a growing trend although it has some fluctuation. The general trend of price is growing steadily. Returns fluctuate prodigious.
The price of SUL is very stable as nearly there is no fluctuation. However, returns of SUL fluctuated heavily. From the data, we can see that it has, the highest monthly return was 24.86% and the lowest was -26.04%.
The price of LNN is quite stable, the standard deviation of LNN is 0.048, and the beta is 0.063. When the price became the top in current five years, the return is also the highest. After that, the return was down to the lowest point
Average Monthly price | Average Monthly Returns | Standard Deviation | Beta | |
WOW | 21.8 | 0.01402 | 0.0550 | 0.7 |
LNN | 8.217 | 0.00521 | 0.0481 | 0.63 |
SUL | 3.04 | 0.00432 | 0.1064 | 1.03 |
In this chart, the average monthly price of WOW is the highest, which means the price is higher than the two other companies are.
Future Growth
Require return=
As risk- free rate (RF) is 2-year Australian Treasury rate in average, which is 2.84%
And he risk-premium is 7.3%, so the E (Rm) is 2.84%+7.3%=10.14%.
WOW: Require return= 2.84% +0.7(10.14%-2.84%) = 7.95%
LNN: Require return= 2.84% +0.63(10.14%-2.84%) = 7.439%
SUL: Require return= 2.84% +1.03(10.14%-2.84%) = 10.359%
As the Sustainable growth= (1- Payout ratio) x ROE
The payout ratio of each share is 69%, 80% and 54%, then the Return on Equity (ROE) is 27.2%, 31.7%and 19%. So,
WOW: sustainable growth= (1- 69%) x 27.2%= 8.432%
LNN: sustainable growth= (1- 80%) x 31.7%= 6.34%
SUL: sustainable growth= (1- 54%) x 19%= 8.74%
Average Historical Growth | Sustainable Growth | Forecast 2-year Growth | |
WOW | 18.5% | 8.432% | 10.6% |
LNN | 9.2% | 6.34% | 7.8% |
SUL | 15.9% | 8.74% | 11.3% |
The date of average historical growth rate, the sustainable growth and the forecast 2-year growth is showed in the table above. And it tells the growth rate in the 5 years.
Sustainable growth rate of earnings or dividend is the product of the ROE and the retention rate. Compared with historical earnings growth rate (18.5%) and forecast earnings growth rate (10.6%), the sustainable growth rate (8.432%) is lower in the WOW Company. In addition, in the LNN Company, the average historical growth is 9.2% and the forecast 2-year growth is 7.8%, the sustainable growth is lower than those two. About the SUL company is the lower than those date in the same stage.
�
1.3 Intrinsic Value
Constant Dividend
The dividend of WOW, LNN and SUL Companies is $0.92, $0.42, $0.13 of each.
Intrinsic Value (no growth) =
WOW: Intrinsic Value =
LNN: Intrinsic Value =
SUL: Intrinsic Value =
The intrinsic value without growth is lower than the current share price of each company. As the share of each company has the big value in market, the current price must be higher than the intrinsic value.
Constant Growth
Intrinsic value (constant growth) =
WOW: Intrinsic value =
LNN: Intrinsic value =
SUL: Intrinsic value =
WOW | LNN | SUL | |
Current share price | $24.89 | $7.97 | $2.30 |
Intrinsic Value(no growth) | $11.57 | $5.68 | $1.25 |
Intrinsic value(constant growth) Sustainable growth Historical average Analyst's forecast | N/A N/A N/A | 40.63 N/A N/A | 8.73 N/A N/A |
ROE | 27.2% | 31.7% | 19% |
Mean Monthly Return | 1.43% | 0.55% | 0.4% |
Required rate of return | 8.13% | 7.765% | 11.415% |
Beta | 0.7 | 0.65 | 1.15 |
Recent 5-year monthly standard deviation | 0.055462 | 0.048436 | 0.10735 |
Discuss, compare and contrast these statistics between the three companies.
WOW: The average monthly price and the currently price for per share of the WOW Company is different from 1 April 2004 to 1 April 2009. However, the different is in the suitable area.
LNN: The average monthly price is $8.217 for per share and the current price for LNN is $7.97 for per share. So it is can be accepted.
SUL: $3.04 is the average monthly price for per share and $2.30 is the currently price for per share in SUL company. The balance between those two prices is $0.74 for per share. The historical price is a little higher than the current price for per share.
The highest current price in these three companies share is WOW Company that is $11.8 for per share. In addition, the SUL company share is the lowest in these three shares, which is $2.5 for per share. While compared with the constant dividend, the WOW share price is lower than the current price. Therefore, it would be sell well. At the same time, it is good for another two companies. The intrinsic values for constant growth for the three shares are much higher than the current prices. �
2.0 THE STORY
WOW
Woolworths Limited, as a large retail store, provides lots of famous brands on food & grocery, liquor, petrol general merchandise and consumer electronics in Australia and New Zealand. It was founded in Sydney in 1924. At that time, it was just a shop providing the necessary goods to people. In 1927, the company became a chain. During the next several decades' years, the company has established BIG Wï¼ÂDick Smith and Safeway successive. Until 1993, Woolworth's group became a listed company and shares were traded on Australian and New Zealand Stock Exchange. At present, it owns more than 3,000 stores and 180,000 employees. In addition, there are 340,000 shareholders, and 40,000 of them are the employees in the company. As a listed company, everyone can access and download financial information easily on their websites. From Part 1, we can calculate the historical growth rate, sustainable growth rate and forecast 2-year growth rate are 18.5%, 8.432% and 10.6% respectively. In general, although the share price in the Woolworths Limited is a little high, but it still is a potential company to the investors.
LNN
Lion Nathan limited is an alcoholic beverages company which operations in Australia and New Zealand. It was built by James Squire in 1795. At that time, it was the first Australia's first brewer. During the next several years, the LNL was growing fast until today. On 1 October, the Lion Nathan creates an extraordinary portfolio representing distinctive wines from renowned regions around Australia and the world. Now it owns 1,800 Australians and 1,400 New Zealanders as the employees. And the shares of the company trade on the both Australian and New Zealand Stock Exchanges. This company contains good corporate governance, which encompasses accountability and transparency to shareholders. The shareholders can know the structure, processes, policies and charters easily anytime. In addition, everyone can find out the annual report on the company website to understand the company and make investment decisions. From 1 April 2004 to 1 April 2009, we can see the historical growth rate of the company is 9.2% and the sustainable growth rate is 6.34% and forecast 2-year growth rate is 7.8%. As what the people said that less risk, less returns. Investors can get the steady dividends from LNL.
SUL
Supercheap Auto Limited is famous of automotive and boating, camping and fishing products. It is the leader in that area. It was founded by Reg and Hazel Rowe and located in Brisbane in 1972. There were 7, 14 and 200 stores in 1993, 1994 and 2006 respectively. In July 2004, the company became the listed company in Australia and the shares were traded on the Australian Stock Exchanges market. Over the past 15 years, Supercheap Auto has experienced more than 25% compound annual revenue growth. The company provides good environment and conditions for their employees, making every client happy to work. Now it owns employees. In addition, the company information can be found on the company website easily in order of making the investment decision. From part 1, during the last five years, the average historical growth and sustainable growth and forecast 2-year growth in SUL is 15.9%, 8.74% and 11.8% respectively. According to the three growth rate, no one can deny that the SUL has a bright future.
�
3.0 FINAL EVALUATION
Base on those questions above, it valuates different dates from three different companies that is Woolworths Limited (WOW), Lion Nathan limited (LNN) and Supercheap Auto Limited (SUL). Form the charts; we can notice the standard deviations are 5.55%, 4.84% and 10.74% of WOW, LNN and SUL. According to these, the risk of SUL is the highest in three companies. SUL is the lowest and WOW is medium. Nonetheless, contrast risk between WOW and SUL, it is only 0.7 per cent. Moreover, an average monthly return of WOW is the highest and SUL is the lowest. WOW and LNN, the beta is lower then 1. It means the risk for the tow shares is lower than market. While the beta for SUL is 1.15 which means the risk is higher than market portfolio of all securities. Therefore WOW is the best choice for the moment. It is because the low risk and high return.
On the other hand, average historical growths are 18.5%, 9.2% and 15.9% about WOW, LNN and SUL. It means in the history WOW can grow faster than others. In addition, the sustainable growth is 8.432%. Even though in the future WOW does not have the highest growth, it still has 10.6% growth in next 2 years. This situation probably on account of the analysts believed that the market in recession now and it will start to recover in a couple of years. In a word, they are still optimistic about the future. All of bates of average historical growth, sustainable growth and forecast growth are the lowest in three companies. As investors, it will become the worst decision if they invest this company. This is likely to owing to the higher payout ratio or lower reinvestment rate of the company. However its future is predicted to be higher than now by any possibility it because of we are in recession now as well. In the future, market is going up. SUL has the highest sustainable growth and forecast growth in chart but average historical growth is lower than WOW. Compare and contrast these data from WOW and SUL, maybe WOW is better because it is more stable.
Furthermore, current share price and intrinsic value of WOW are both the highest in this group. They are $24.89 and $11.57. The other way round, SUL is the lowest that are $2.3 and $1.25. LNN is medium. Due to mean monthly return of WOW is nearly three times than LNN even through recent 5-year monthly standard deviation is a little bit higher than LNN; it still can not stop the belief of investors to put capital into this company.
If I have $10,000 to invest at this moment, i can not put all money at one company. Because I can not get the most returns into one company. Even through the return is medium, so the risk of LNN is the lowest. So I don't need too much worry to get my money back. Thus, I can put 20% of capital in LNN. In a word, investment means risk. So if you want to get more money, you have to get risk. The risk of SUL is the highest but share price and intrinsic price are very cheap, forecast growth is very high and required rate of return is high as well. It means I can spend lower price to buy shares and in the future they will have more values. Therefore, I also can put 20% of capital in SUL. In the end, at all tables, WOW all can get the best estimation. Consequently, more than half of money will put into this company. The total capital is $6,000 in WOW. �
WOW | LNN | SUL | |||||||
Date | Adj Close | Returns | S.D. | Adj Close | Returns | S.D. | Adj Close | Returns | S.D. |
1/04/2004 | 11.8 | 6.25 | |||||||
3/05/2004 | 11.7 | -0.0076 | 0.00047 | 6.51 | 0.04160 | 0.00132 | |||
1/06/2004 | 11.4 | -0.0265 | 0.00164 | 6.78 | 0.04147 | 0.00131 | |||
1/07/2004 | 11.7 | 0.02719 | 0.00017 | 6.97 | 0.02802 | 0.00052 | 2.5 | ||
2/08/2004 | 12.7 | 0.08027 | 0.00439 | 7.1 | 0.01865 | 0.00018 | 2.86 | 0.14400 | 0.01951 |
1/09/2004 | 13.6 | 0.07668 | 0.00393 | 7.38 | 0.03944 | 0.00117 | 3.1 | 0.08392 | 0.00634 |
1/10/2004 | 13.4 | -0.0176 | 0.00100 | 7.88 | 0.06775 | 0.00391 | 3.15 | 0.01613 | 0.00014 |
1/11/2004 | 15 | 0.12108 | 0.01146 | 7.95 | 0.00888 | 0.00001 | 3.29 | 0.04444 | 0.00161 |
1/12/2004 | 15 | 0.00067 | 0.00018 | 8.6 | 0.08176 | 0.00586 | 3.19 | -0.03040 | 0.00121 |
3/01/2005 | 14.6 | -0.028 | 0.00176 | 8.2 | -0.04651 | 0.00268 | 3.16 | -0.00940 | 0.00019 |
1/02/2005 | 15.6 | 0.06648 | 0.00275 | 7.54 | -0.08049 | 0.00734 | 3.14 | -0.00633 | 0.00011 |
1/03/2005 | 16.1 | 0.03149 | 0.00031 | 7.25 | -0.03846 | 0.00191 | 3.02 | -0.03822 | 0.00181 |
1/04/2005 | 15.3 | -0.0474 | 0.00377 | 7.29 | 0.00552 | 0.00000 | 2.65 | -0.12252 | 0.01609 |
2/05/2005 | 16.1 | 0.05101 | 0.00137 | 7.35 | 0.00823 | 0.00001 | 2.75 | 0.03774 | 0.00112 |
1/06/2005 | 16.5 | 0.02738 | 0.00018 | 7.58 | 0.03129 | 0.00068 | 2.82 | 0.02545 | 0.00045 |
1/07/2005 | 16.4 | -0.0067 | 0.00043 | 7.4 | -0.02375 | 0.00084 | 3.04 | 0.07801 | 0.00543 |
1/08/2005 | 16.3 | -0.0092 | 0.00054 | 8.04 | 0.08649 | 0.00661 | 3.09 | 0.01645 | 0.00015 |
1/09/2005 | 16.6 | 0.02339 | 0.00009 | 8.39 | 0.04353 | 0.00147 | 2.92 | -0.05502 | 0.00352 |
3/10/2005 | 16.3 | -0.018 | 0.00103 | 7.89 | -0.05959 | 0.00420 | 2.8 | -0.04110 | 0.00206 |
1/11/2005 | 17 | 0.04164 | 0.00076 | 7.44 | -0.05703 | 0.00387 | 2.85 | 0.01786 | 0.00018 |
1/12/2005 | 16.9 | -0.0094 | 0.00055 | 7.64 | 0.02688 | 0.00047 | 2.85 | 0.00000 | 0.00002 |
2/01/2006 | 17.3 | 0.02374 | 0.00009 | 7.49 | -0.01963 | 0.00062 | 2.2 | -0.22807 | 0.05401 |
1/02/2006 | 18.4 | 0.06667 | 0.00277 | 8 | 0.06809 | 0.00395 | 2.6 | 0.18182 | 0.03151 |
1/03/2006 | 18.8 | 0.02337 | 0.00009 | 8.11 | 0.01375 | 0.00007 | 2.37 | -0.08846 | 0.00861 |
3/04/2006 | 18.7 | -0.009 | 0.00053 | 8.32 | 0.02589 | 0.00043 | 2.23 | -0.05907 | 0.00402 |
1/05/2006 | 18.6 | -0.0032 | 0.00030 | 7.75 | -0.06851 | 0.00543 | 2.15 | -0.03587 | 0.00162 |
1/06/2006 | 20.2 | 0.08333 | 0.00480 | 7.8 | 0.00645 | 0.00000 | 1.59 | -0.26047 | 0.07011 |
3/07/2006 | 19 | -0.0551 | 0.00478 | 7.87 | 0.00897 | 0.00001 | 1.85 | 0.16352 | 0.02535 |
1/08/2006 | 20.7 | 0.08719 | 0.00535 | 7.98 | 0.01398 | 0.00008 | 2.31 | 0.24865 | 0.05970 |
1/09/2006 | 20.3 | -0.0213 | 0.00124 | 8.1 | 0.01504 | 0.00010 | 2.5 | 0.08225 | 0.00607 |
2/10/2006 | 20.7 | 0.02122 | 0.00005 | 8.29 | 0.02346 | 0.00033 | 2.73 | 0.09200 | 0.00769 |
1/11/2006 | 22 | 0.06332 | 0.00243 | 8.09 | -0.02413 | 0.00086 | 2.65 | -0.02930 | 0.00113 |
1/12/2006 | 23.9 | 0.08636 | 0.00523 | 8.16 | 0.00865 | 0.00001 | 3.05 | 0.15094 | 0.02150 |
1/01/2007 | 23.8 | -0.0063 | 0.00041 | 8.3 | 0.01716 | 0.00014 | 3.55 | 0.16393 | 0.02548 |
1/02/2007 | 27.2 | 0.14526 | 0.01723 | 8.29 | -0.00120 | 0.00004 | 3.8 | 0.07042 | 0.00437 |
1/03/2007 | 27.2 | -0.0004 | 0.00021 | 8.84 | 0.06634 | 0.00374 | 4.05 | 0.06579 | 0.00378 |
2/04/2007 | 28.3 | 0.04082 | 0.00072 | 9.15 | 0.03507 | 0.00089 | 4.61 | 0.13827 | 0.01794 |
1/05/2007 | 27.5 | -0.0279 | 0.00176 | 9.14 | -0.00109 | 0.00004 | 4.51 | -0.02169 | 0.00068 |
1/06/2007 | 27 | -0.0185 | 0.00106 | 9.27 | 0.01422 | 0.00008 | 4.3 | -0.04656 | 0.00259 |
2/07/2007 | 27.3 | 0.01074 | 0.00001 | 8.5 | -0.08306 | 0.00779 | 4.74 | 0.10233 | 0.00961 |
1/08/2007 | 29.9 | 0.09637 | 0.00678 | 9.17 | 0.07882 | 0.00542 | 4.79 | 0.01055 | 0.00004 |
3/09/2007 | 29.7 | -0.007 | 0.00044 | 9.23 | 0.00654 | 0.00000 | 4.49 | -0.06263 | 0.00448 |
1/10/2007 | 33.5 | 0.12588 | 0.01251 | 9.28 | 0.00542 | 0.00000 | 4.75 | 0.05791 | 0.00287 |
1/11/2007 | 33.9 | 0.01196 | 0.00000 | 9.23 | -0.00539 | 0.00011 | 4.36 | -0.08211 | 0.00747 |
3/12/2007 | 34 | 0.00414 | 0.00010 | 9.61 | 0.04117 | 0.00129 | 4.3 | -0.01376 | 0.00033 |
1/01/2008 | 28.8 | -0.1527 | 0.02779 | 9.45 | -0.01665 | 0.00048 | 3.6 | -0.16279 | 0.02793 |
1/02/2008 | 29 | 0.0066 | 0.00006 | 9.55 | 0.01058 | 0.00003 | 3.4 | -0.05556 | 0.00359 |
3/03/2008 | 29 | 0.00035 | 0.00019 | 8.75 | -0.08377 | 0.00792 | 3.15 | -0.07353 | 0.00606 |
1/04/2008 | 28.7 | -0.0103 | 0.00059 | 8.35 | -0.04571 | 0.00259 | 2.85 | -0.09524 | 0.00991 |
1/05/2008 | 27.7 | -0.0342 | 0.00232 | 9.66 | 0.15689 | 0.02300 | 3.09 | 0.08421 | 0.00638 |
2/06/2008 | 24.5 | -0.118 | 0.01742 | 8.55 | -0.11491 | 0.01443 | 2.38 | -0.22977 | 0.05480 |
1/07/2008 | 25.2 | 0.03068 | 0.00028 | 8.83 | 0.03275 | 0.00076 | 2.6 | 0.09244 | 0.00776 |
1/08/2008 | 28.4 | 0.1254 | 0.01241 | 8.93 | 0.01133 | 0.00004 | 2.66 | 0.02308 | 0.00035 |
1/09/2008 | 27.2 | -0.0409 | 0.00302 | 9.27 | 0.03807 | 0.00108 | 2.47 | -0.07143 | 0.00574 |
1/10/2008 | 27.8 | 0.02206 | 0.00006 | 8.79 | -0.05178 | 0.00325 | 2.19 | -0.11336 | 0.01385 |
3/11/2008 | 26.8 | -0.036 | 0.00250 | 8.68 | -0.01251 | 0.00031 | 2.2 | 0.00457 | 0.00000 |
1/12/2008 | 26.7 | -0.0049 | 0.00036 | 8.22 | -0.05300 | 0.00339 | 2.68 | 0.21818 | 0.04574 |
2/01/2009 | 27.7 | 0.03862 | 0.00061 | 8.2 | -0.00243 | 0.00006 | 2.3 | -0.14179 | 0.02135 |
2/02/2009 | 26.1 | -0.0563 | 0.00495 | 8.56 | 0.04390 | 0.00150 | 2.45 | 0.06522 | 0.00371 |
2/03/2009 | 25 | -0.0432 | 0.00328 | 8.08 | -0.05607 | 0.00376 | 2.25 | -0.08163 | 0.00739 |
1/04/2009 | 24.9 | -0.0048 | 0.00035 | 7.97 | -0.01361 | 0.00035 | 2.3 | 0.02222 | 0.00032 |
Mean | 21.8 | 0.01402 | 8.217 | 0.00521 | 3.04 | 0.00432 | |||
Standard Deviation | 0.05505 | 0.04806 | 0.1064 |
Appendix 1�
Reference List
1. Woolworths Limited, 17/05/2009
(a)http://www.woolworthslimited.com.au/phoenix.zhtml?c=144044&p=homepage
Lion Nathan Limited, 17/05/2009
(a)http://www.lion-nathan.com.au/Great-Company/About-Us/History.aspx
(b)http://www.lion-nathan.com.au
Supercheap Auto Limited, 17/05/2009
(a)http://www.supercheapauto.com.au/corporate/company-history.aspx
(b)http://www.supercheapauto.com.au/corporate/investor-centre/corporate-governace.aspx
Returns %
Prices
$/%
Months
61
57
53
49
45
41
37
33
29
25
21
17
13
9
5
1
40
30
20
10
0
-10
-20
WOW Monthly Price and Returns
Returns %
Prices
$/%
Months
58
55
52
49
46
43
40
37
34
31
28
25
22
19
16
13
10
7
4
1
30
20
10
0
-10
-20
-30
SUL Monthly Price and Returns
Returns %
Prices
$/%
Months
61
57
53
49
45
41
37
33
29
25
21
17
13
9
5
1
20
15
10
5
0
-5
-10
-15
LNN Monthly Prices and Returns
�PAGE � �PAGE �13�