MANAGEMENT ACCOUNTING AND BUSINESS DECISION MAKING - ASSIGNMENT 2
NAME: Alex
GROUP NUMBER: B
LEVEL: Intermediate
HAND IN DATE: 13/01/2006
Task 1
Objectives: 1. To be able to demonstrate the ability to critically analyse given data using ratio analysis techniques.
Profitability
1. Return on ordinary shareholders' funds= ROSF
ROSF= Net profit after taxation and preference dividend
Ordinary share capital plus reserves
2004= 1,123* 100 = 3.91%
28,724
2005= 1,655 * 100 = 5.59%
29,632
2. Return on capital employed= ROCE
ROCE= Net profit before interest and taxation *100
Share capital+ Reserves + Long-term loans
2004= 1,701 *100 =5.92%
28,724
2005= 2,534 *100 = 8.55%
29,632
3. Net profit margin= Net profit before interest and taxation *100
Sales
2004= 1,701 *100 =14.58%
11,659
2005= 2,534 *100 = 12.37%
20,479
4. Gross profit margin= Gross profit *100
Sales
2004= 2,426 *100 = 20.81%
11,659
2005= 3,192 *100 =15.59%
20,479
Efficiency
Average stock (inventory) turnover period= Stock held * 365
Cost of sales
2004= 2,904 *365 days = 114.8
 adsense_revenue_sharing
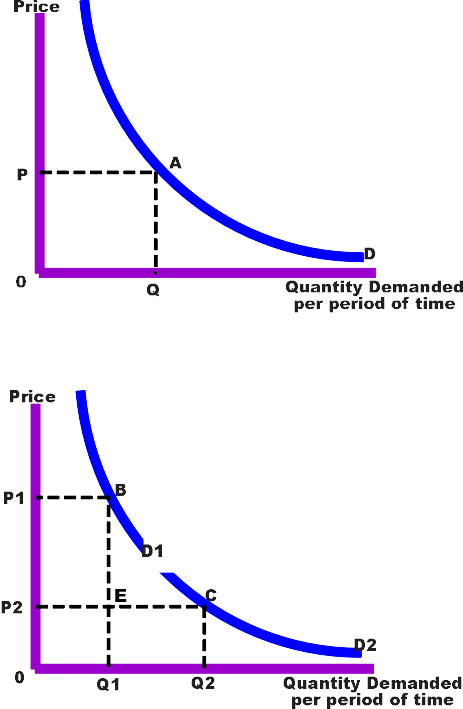 English: price discrimination
 Revenue
days
9,233
2005= 4,406 *365 days = 93 days
17,287
Average settlement period for debtors= Trade debtors *365
Credit sales revenue
2004= 1,482 * 365 days = 46.4days
11,659
2005= 3,793 *365 days =67.6 days
20,479
Average settlement period for creditors= Trade creditors *365
Credit purchases
2004= 1,157 * 365 days = 45.7 days
9,233
2005= 1,976 * 365 days = 41.7 days
17,287
Sales revenue to capital employed ratio= SRCE
SRCE= Sales revenue
Share capital+ reserves+ Non-current liabilities
2004= 11,659 = 0.41 times
28,724
2005= 20,479 = 0.69 times
29,632
Liquidity
1. Current Ratio= Current assets
Current liabilities
2004= 5,247 = 0.76:1
6,870
2005= 8,203 = 0.64:1
12,730
2. Acid test ratio= Current assets (excluding stock)
Current liabilities
2004= 5,247 - 2,903 = 0.34:1
6,870
2005= 8,203 - 4,406 =0.3:1
12,730
3. Cash generated from operations to maturing obligations= CGOMO
CGOMO= Cash generated from operations
Current liabilities
2004= 4,852 = 0.7 times
6,870
2005= 1,376 = 0.1 times
12,730
Gearing
1. Gearing ratio= Long term( non -current )liabilities *100
Share capital + reserves + long term (non-current) liabilities
2004= 0 * 100 = 0%
29,632 + 0
2005= 0 *100 = 0%
28,724 + 0
2. Interest cover ratio= Profit before interest and taxation
Interest payable
2004= 1,701 =17.54 times
97
2005= 2,534 = 17.85 times
142
Investment ratios
1. Dividend payout ratio= Dividends announced for the year *100
Earnings for the year available for dividends
2004= 668 *100 =59.48%
1,123
2005= 779 *100 = 47.07%
1,655
2. Price/earnings (P/E) ratio= Market value per share
Earnings per share
2004= 93.75 = 20.42 times
4.59
2005= 198 = 29.29 times
6.76
Objectives: 2
To be able to write a good report from the perspectives set out in the case study and to make positive recommendations in both instances.
Introduction:
Ratio analysis is an excellent method for determining the overall financial condition of your small business. It puts the information from a financial statement into perspective, helping to spot financial patterns that may threaten the health of your company.
Ratios are also very useful for making comparisons between your business and other businesses in your industry. For example, comparing ratios can indicate whether a business is holding too much inventory or collecting receivable too slowly. This comparison provides a window into ways in which your business can improve its operations.
In the case study, we start our detailed look at the ratios for Sutton Harbour Holding plc finial account. From the company general background we knew earnings per share have increased from 4.63p to 6.81p, an increase of 47%. At the half-year stage they paid an interim dividend of 1.1p per ordinary share, a 22% increase on the interim dividend paid in the previous years. These ratios will usually highlight some points that could help us in our interpretation of the ratios.
Profitability
Profitability Ratios which use margin analysis and show the return on sales and capital employed. There are 4 main ratios I am going to discusses how company to uses these ratios to analyze and measures the business performance.
Return on ordinary shareholders' funds
The return on ordinary shareholder's funds shows the overall efficiency of the company in employing ordinary shareholders resources and the ratio compares the amount of profit for the period available to the owners. Broadly, business seeks to generate as high a value as possible for this ratio, provided that it is not achieved at the expense of potential future returns.
The ROSF ratio still shows a poor profit performance. There is not too much profit was made to the owners, according to the figures this could because the cost of sales is too high and the taxation was increasing as well. However, compare with 2004 ratio it has a slightly increase by 1.68% in 2005.
Return on capital employed
The return on capital employed (ROCE) Tells us how much profit we earn from the investments the shareholders have made in their company and it is a fundamental measure of business performance. 2005 ratio tells much the same story as ROSF, namely a slightly better performance, with the return on the assets being less than the rate that the business has to pay for most of its borrowed funds.
Net profit margin
Once again the net profit margin ratio tells us the amount of net profit per ã1 of turnover a business has earned and this ratio provides a slightly weak performance compared with that of 2004. There was a slightly decrease by 2.19% in 2005. After paying the cost of the goods sold and other expenses of operating the business there is 12.37p drop for every 1 pound.
Gross profit margin
The gross profit margin ratio tells us the profit a business makes on its cost of sales, or cost of goods sold. It is a very simple idea and it tells us how much gross profit per ã1 of turnover our business is earning. As a part of the decline in the net profit margin ratio is linked to the dramatic decline in the gross profit margin ratio. Whereas, after paying for the goods sold, for each ã1 of sales revenue 20.81p was left to cover other operating expenses and leave a profit in 2004, this was only 15.59p in 2005. The 2005 gross profit ratio indicates that cost of sales was lower relative to sales revenue in 2005 than it had been in 2004.
Efficiency
Average stock (inventory) turnover period
Stock Turnover period ratio measures the average period for which stocks are being held. From the ratio we can see that the stock held is being 'turned over' every 114.8 days in 2004, and it is 93 days in 2005 which it dropped 21.8 days It shows us that in 2005 the stock turnover period was too long. A business normally prefer a shot turnover period to long one, as funds tied up in stocks cannot be used for other purposes. Therefore, the company should consider the stock of demand, the possibility of supply shortages and the likelihood of price rises which can possible to improve the stock.
Average settlement period for debtors
Average settlement period for debtors calculates how long, on average, credit customers take to pay the amounts that they owe to the business. Comparison the two ratios, there are 6 days different between 2004 and 2005. This reduction in the settlement period is welcome. It means that less cash was tied up in debtors for each ã1 of sales revenue in 2005 than in 2004. However, only if the reduction were achieved at the expense of customer goodwill or a high direct financial cost, might the desirability of the reduction be questioned.
Average settlement period for creditors
Average settlement period for creditors as trade creditors provide a free source of finance for the business and it calculates how long the business takes to pay its trade creditors, which is very relevant to the supplier. From this case study, this is beneficial because the business is using free finance provided by suppliers for 41.7 days in 2005.
Sales revenue to capital employed ratio examines how effectively the assets of the business are being used to generate sales revenue. Generally speaking, a higher asset turnover ratio is preferred to a lower one. According to these ratios, there are 0.28 times be improved in 2005.
Investment
The dividend payout ratio measures the proportion of earnings that a business pays out to shareholders in the form of dividends. In the case of ordinary shares, the earning available for dividend will normally is the profit after taxation and after any preference dividends announced during the period. Compare with 2004 and 2005, the ratio has dropped by 12.41%. In the case of Sutton Harbour Holdings plc, (for 2004) the ratio should be1,123/668=1.7times. Therefore the earnings available for dividend cover the actual dividend by just 1.7 times.
The price/earnings (P/E) ratio
The P/E ratio relates the market value of a share to the earnings per share. This ratio reveals that the capital value of the share is 20.42 times higher than its current level of earnings. The ratio is a measure of market confidence in the future of a business. This ratio shows that there is a great confidence in the future earning power of the business and, consequently, the more investors are prepared to pay I relation to the earnings stream of the business. Therefore, we can see from the P/E ratios over two years that Sutton Harbour Holdings plc has been increased the confidence in the future earning power of the business.
Liquidity
Current Ratio
Current ratio is an indication of a company's ability to meet short-term debt obligations; the higher the ratio, the more liquid the company is. Current ratio is equal to current assets divided by current liabilities. If the current assets of a company are more than twice the current liabilities, then that company is generally considered to have good short-term financial strength. If current liabilities exceed current assets, then the company may have problems meeting its short-term obligations. Accounting to the current ratios, there is a gradually decline from 0.76 times in 2004 to 0.64 in 2005. This means more cash or other liquid assets are tied up in 2005. However, it is not necessarily a matter of concern, the next ratio may provide a clue as to whether there seems to be a problem.
Acid test ratio
Acid test ratio is a stringent test that indicates if a firm has enough short-term assets to cover its immediate liabilities without selling inventory. The acid-test ratio is far more strenuous than the working capital ratio, primarily because the working capital ratio allows for the inclusion of inventory assets. The 2005 ratio shows a gradually badly performance than 2004 ratio. The 2005 level may well be a cause for concern. As we can see that the liquid current assets do not quite cover the current liabilities, so the business may be experiencing some liquidity problems. They need to try gain more cash and debtors from the business and hopefully the new investments will improve the ratios in the future.
Cash generated from operations to maturing obligations ratio compares the cash generated from operation to the current liabilities of the business. It provides a further indication of the ability of the business to meet its maturing obligations, the higher this ratio, the better the liquidity of the business. However, the ratio provides another weak figures it has dropped by 0.6 time during 2004 and 2005. The ratio shows an alarming decline in the ability of the business to meet its maturing obligations from its operating cash flows. This confirms that liquidity is a real cause for concern for the business.
Gearing
Financial gearing occurs when a business is financed, at least in part, by borrowing, instead of finance provided by the owners (the shareholders). A business gearing (that is, the extent to which it is financed from sources that require a fixed return) is an important factor in assessing risk. In addition, an effect of gearing is that returns to shareholders become more sensitive to changes in profits. For a highly geared business, a changer in profits can lead to a proportionately greater change in the ROSF ratio. The Sutton Harbour Holdings financing gearing ratio has an increase that has risen by 14.3% from 2004.
Conclusion
Financial ratio provides a quick and relatively simple means of assessing the financial health of a business. A ratio simply relates one figure appearing in the financial statements to some other figure appearing there or, perhaps, to some resource of the business.
The report analyze and discover that caused the increase in both cost of sales and operating costs, relative to sales revenue, from 2004 to 2005. The liquidity ratio provides information about if the cash flow keeps the same problems, it will be really hard to increase the company credit limit. I suggest if the new investment can be used effectively, the profitability and investment ratios could be increase again in the next year.
References
MCLANEY, M &ATRJLL, P., 2005. Accounting, An introduction 3rd Edition. London, Financial Times, Prentice Hall.
Mintel Group. December 2004. Leisure Intelligence: UK - Travel, Leisure Intelligence
[online] Available from
http://www.bized.ac.uk/compfact/ratios/
[Cited 10 January 2005]
ELLJOTT B and ELLJOTT J, 8th edition, London, Financial Times, Prentice Hall, 2004
�PAGE � �PAGE �10�
Great....
I think this is good, it was able to help me in my exam! I read this before and was able o use the information in an exam! So great job!
(",)
1 out of 1 people found this comment useful.