The approach which I used towards solving for the case consisted of regression runs and decomposition forecasting. The given data consisted of non aligned months, missing observations and billing issuance dates variability. The utility usage is expressed in units of consumption so inflation is not taken into account in the modeling through regression. The break up of the technique that I used is given in steps as under.
1)Cleaning the data2)Modeling for Natural Gas Usage3)Forecasting of Usage in June, July & August4)Modeling for Electricity Usage5)Forecasting of Usage in June, July & August6)Classical Decomposition Forecasting7)Comparing of Regression Forecasting & Decomposition Forecasting1) Cleaning the DataThe cleaning of data was done in different steps which are given as under.
a) Adjusting Variable SixI opened the data file through SPSS. There were ten missing points in the data but actually there are two missing values. Eight values are explained in the case as it explains that starting in 1993; the company has sent bills in June, August and October, and the latter two bills account about 60 calendar days rather than 30.
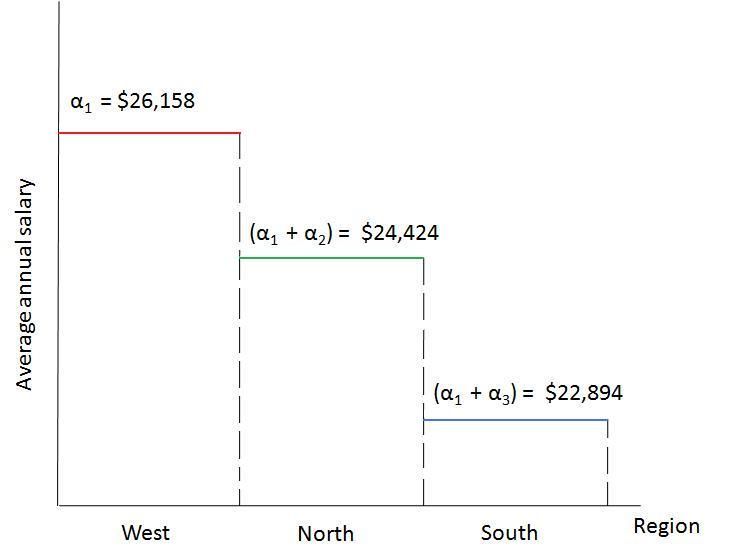 English: This graph has been used to depict the re...
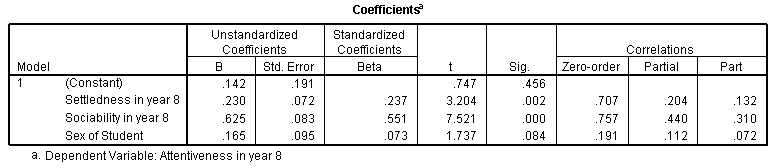 English: Multiple linear regression coefficient ta...
 Linear-regression
So the values from Jul-93 to Sept-96 are adjusted by dividing the lower row by two and writing the same values in adjacent rows. In this manner eight values were entered in the variable 6 i-e Days in the gas company billing cycle for the month.
b) Replacing Missing ValuesFirstly the variable type of V4, V5 and V6 was selected to be Numeric in SPSS. Missing values of the variables V4, V5 and V6 were replaced by using SPSS. Used the command Transform>Replace missing value. Selected the variables one by one and used the method Mean of nearby points where the span of nearby points was selected to be four. I tried different values of span by nearby points as I started...