Summarize data using measures of central tendency, such as the mean, median, mode, and midrange.
Describe data using the measures of variation, such as the range, variance, and standard deviation.
Identify the position of a data value in a data set using various measures of position, such as percentiles, deciles, and quartiles.
Use the techniques of exploratory data analysis, including boxplots and five-number summaries to discover various aspects of data.
Statistical methods can be used to summarize data.
Measures of average are also called measures of central tendency and include the mean, median, mode, and midrange.
Measures that determine the spread of data values are called measures of variation or measures of dispersion and include the range, variance, and standard deviation.
Measures of position tell where a specific data value falls within the data set or its relative position in comparison with other data values.
The most common measures of position are percentiles, deciles, and quartiles.
 Standard deviation illustration
 Z-tabelle
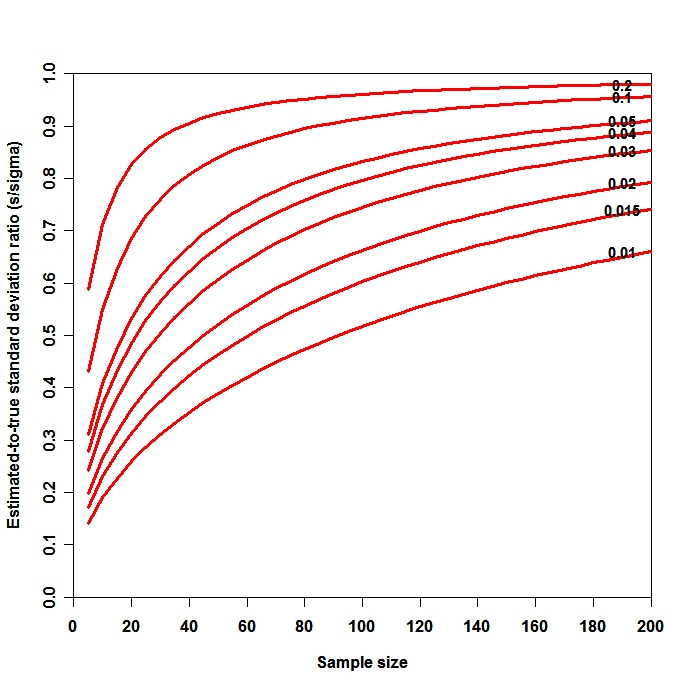 English: Graph of bias in estimated standard devia...
The measures of central tendency, variation, and position are part of what is called traditional statistics. This type of data is typically used to confirm conjectures about the data.
Another type of statistics is called exploratory data analysis. These techniques include the the box plot and the five-number summary. They can be used to explore data to see what they show.
A statistic is a characteristic or measure obtained by using the data values from a sample.
A parameter is a characteristic or measure obtained by using all the data values for a specific population.
When the data in a data set is ordered it is called a data array.
In statistics the basic rounding rule is that when computations are done in the calculation, rounding should not be done until the final answer is calculated.
The mean is the sum of the values...
Outline of Chapter 3: Elem. Stats
This is the best paper for RES 341!
1 out of 1 people found this comment useful.