Performance Test of a Compression Ignition Engine
Matthew Steven, 0503527
Aim
To investigate the fundamentals of a compression ignition (I.C.) engine with respect to performance by determining the efficiency and where losses occur.
Objectives
The objective of this report is to:
Measure the performance of a compression ignition engine.
Measure the mechanical losses in the engine.
Measure the heat losses.
Method
After allowing the engine to warm up the fuel control was set to maximum. Initially starting with no-load, the dynamometer loading was increased and all data was recorded in the 'Observed Results' table (page 5) before increasing the load and repeating. My investigation of my results comprised 3 parts.
Part A: Measure/Determine the performance of the compression ignition engine.
Using my recorded results from the 'Observed Results' table, I calculated:
Brake Power (kW)
Brake Mean Effect of Pressure, (Bp) (kN/m2)
Brake specific Fuel Consumption (L/kW - hr)
Brake thermal efficiency
These were then noted in 'Calculated Results: Table A' (Page 6).
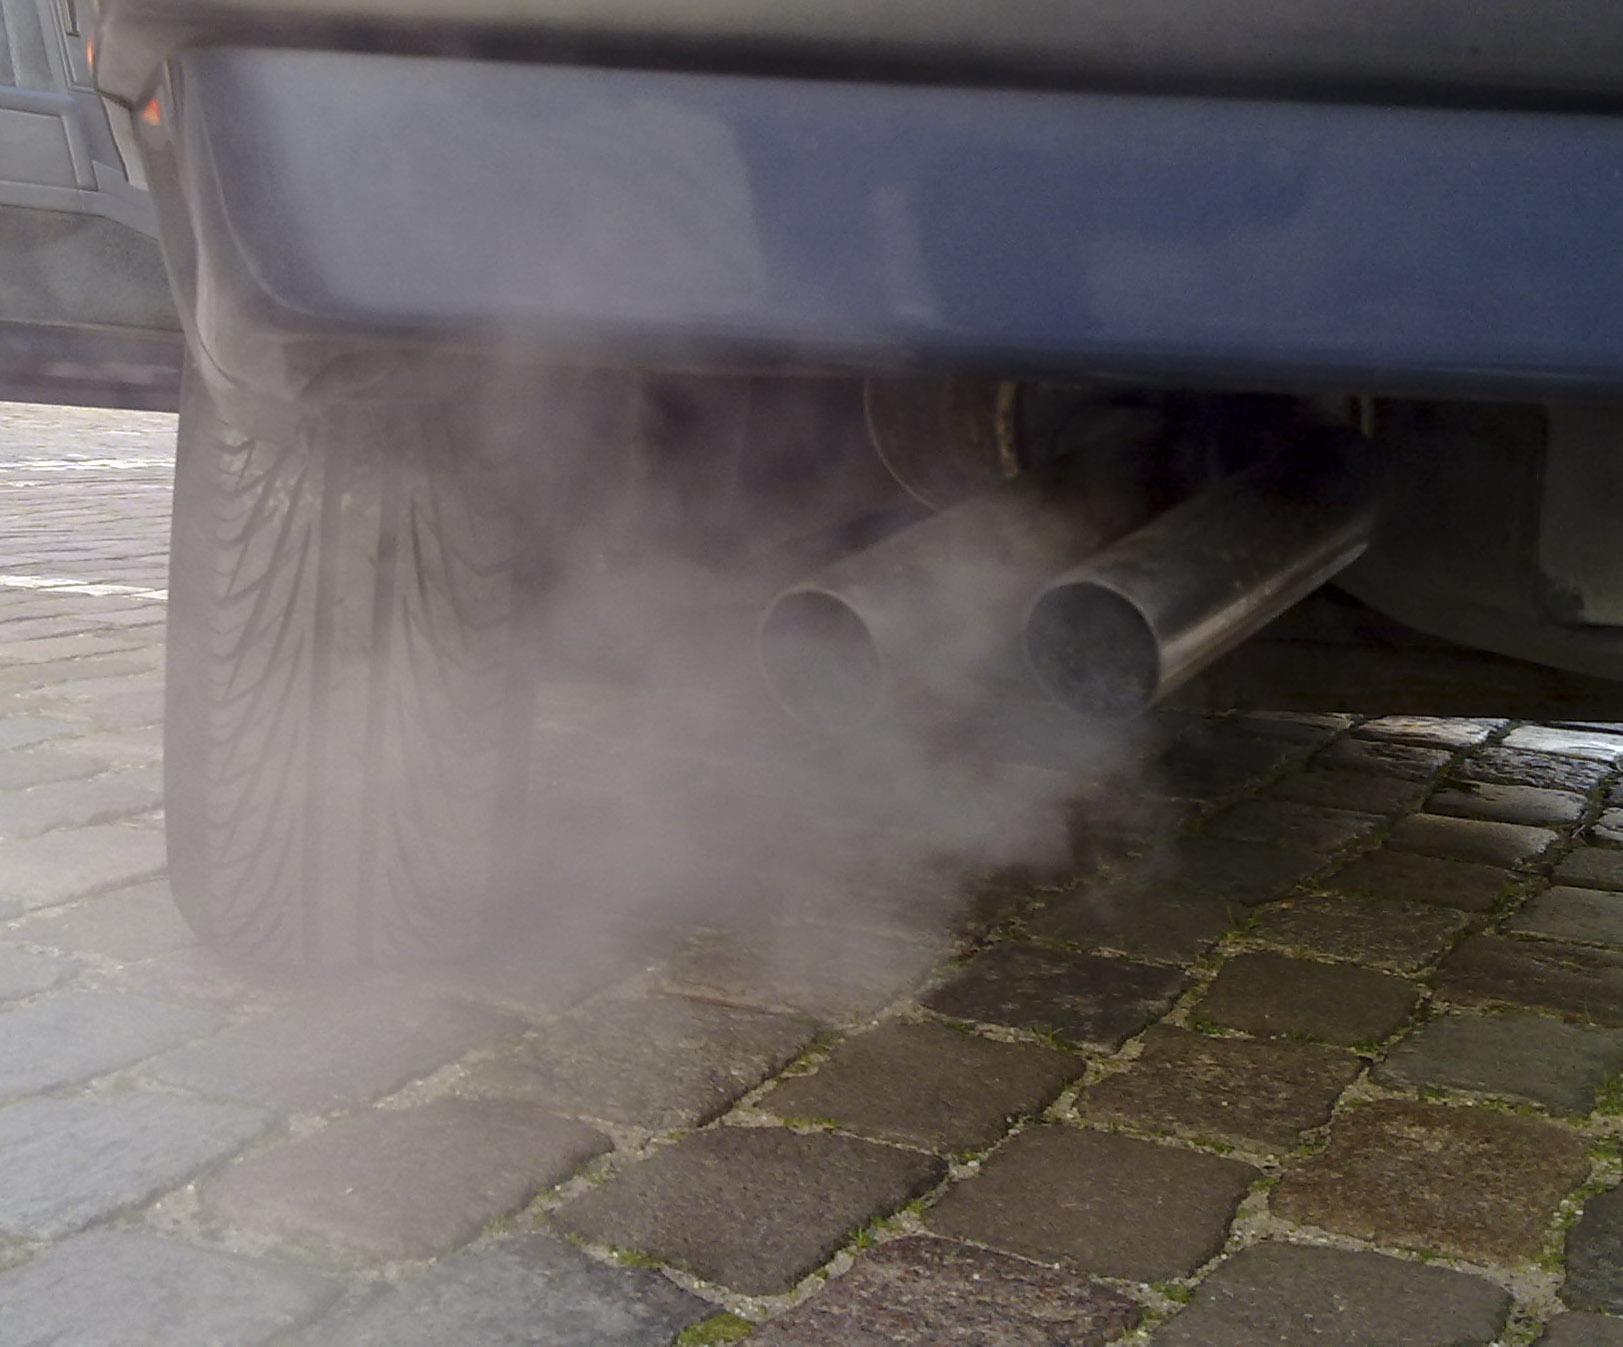 English: Automobile exhaust gas. White exhaust gas...
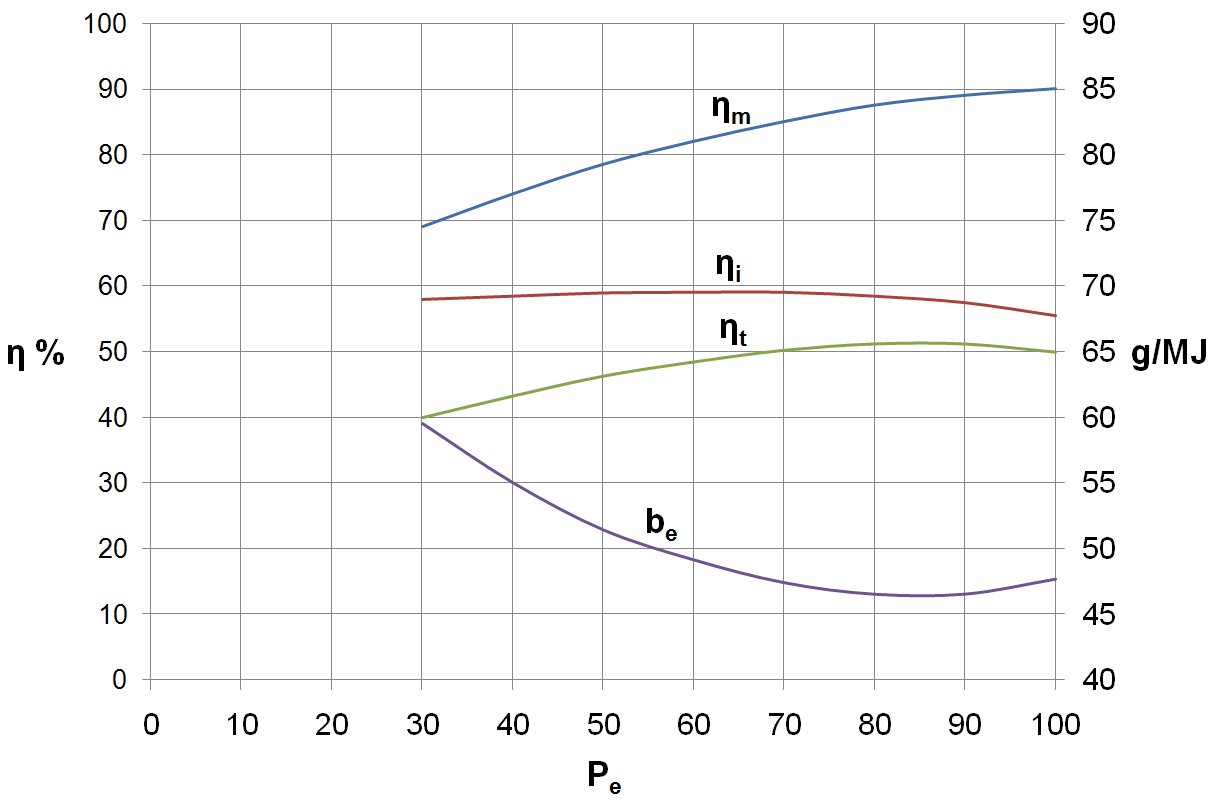 English: Efficiencies of two stroke diesel engine....
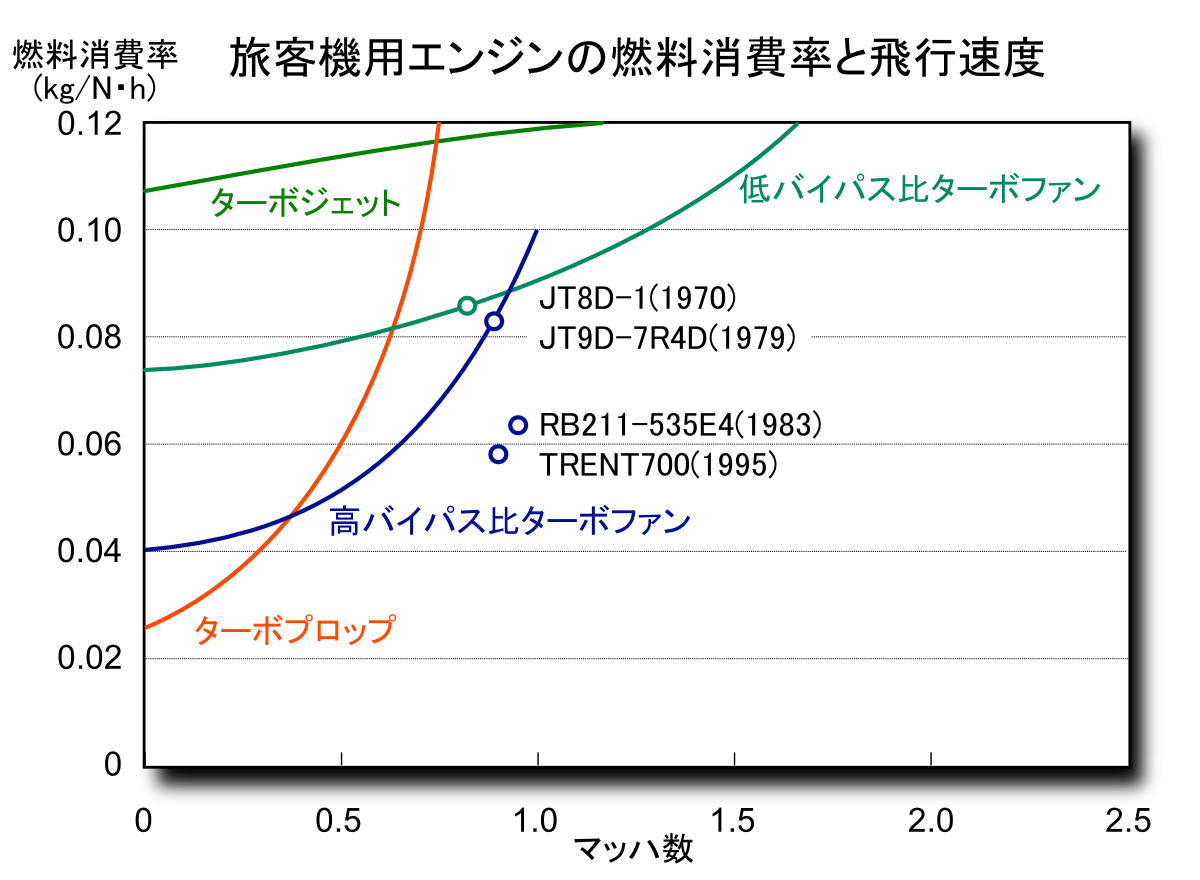 English: Jet engines' Thrust specific fuel consump...
I then proceeded to construct graphs of Torque, Power, Brake Specific Fuel Consumption and thermal Efficiency against the Brake Mean Effective Pressure (B.M.E.P) (Pages 7 - 10).
Part B: Measure/Determine the mechanical losses in the engine by extrapolating the Willans line.
For part B I plotted a graph of Fuel Consumption versus the B.M.E.P which allowed me to estimate the mechanical losses in the engine (page 11).
Part C: Measure/Determine the heat losses.
From my observed results I was able to determine:
Heat of combustion of fuel, H1
Brake Power output, P
Heat to exhaust, H2
Heating to cooling water, Q1
Other losses, Q2
These values where noted in Calculated Results: Table B: Heat Losses (page 12). These values allowed me to further calculate the percentage values of where heat losses occurred and to plot the graph of...