Regression Analysis Looking at the answer from the multiple regression assignment and the handout from class I found out that they do not match. When I was looking at the handout from class, I found out that there were, only 12 observations in the regression assignment there were 24 observations. At the end of the assignment, I concluded that all x-variables were good explanations of the model. We found out income was the only variable that was significant on the handout. On the regression assignment, all variables were significant to the model.
Column by Column Coefficient The coefficient is explained by simply the slope of the line. For example, the rainfall and Real Income had a positive effect on the DVD Expenditures. The only negative slope was the Real Price of the DVD. If the price went up then that person would buy less DVD's.
P-Value The P-Value is estimating if the models derived are significant or not significant to the overall model.
 English: This graph has been used to depict an exa...
 Man, soon as I knew what it was, I started seeing ...
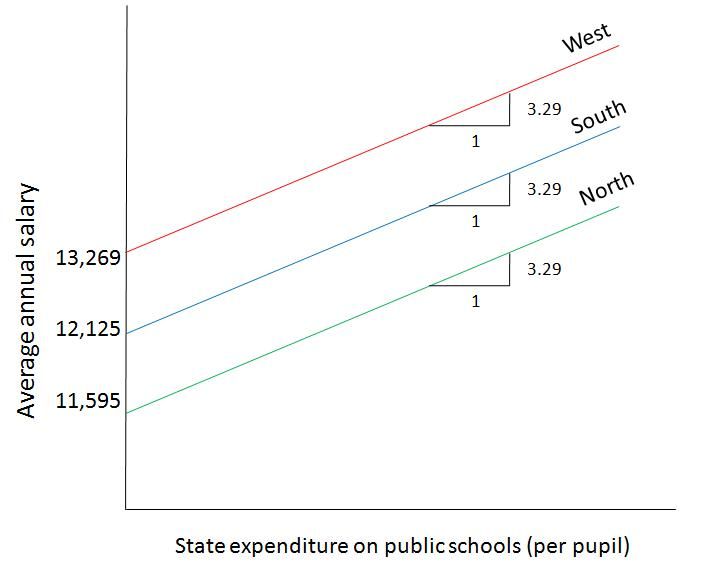
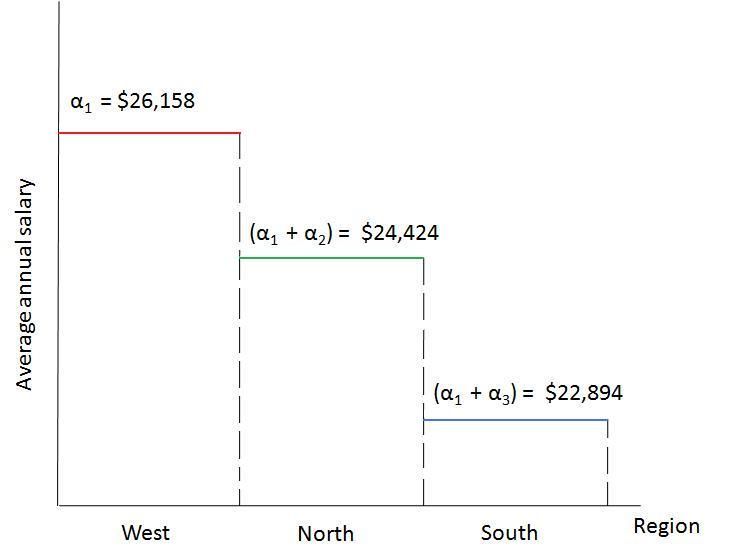 English: This graph has been used to depict the re...
When the P-value of a model is less then 5% then simply we can say the data is 95% significant to the model and 5% chance that the date is not.
If the regression model worked? I would say that the regression model works because the R-Square came out at 0.788. At first, I thought that Rainfall was a Junk Variable but latter I thought that if the weather is bad then people stay home and watch movies and other such things in their homes.
 Eating ice cream
 tying a knot
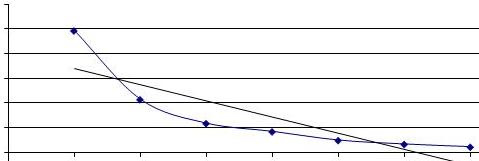 exponential curve data