1.0Aim:The aim of this experiment is to investigate the relationship between the heat and amount of reaction of an experiment.
2.0Theory:When an acid solution (i.e. HCl) is mixed with a solution of a base (i.e. NaOH), hydrogen ions from the acid react with hydroxide ions from the base, thereby forming water. This reaction causes heat to be released, resulting in the temperature of the reaction mixture rising:H+(aq) + OH-(aq) H2O(l)In this experiment, several reaction mixtures will be made, each containing various concentrations of acid and hydroxide solutions. As the volumes of the reaction mixtures are the same, the temperature changes are relative measures of the quantity of heat released.
3.0Equipment:3 x Test tubesTest tube rackThermometer2 x Measuring cylindersHydrochloric acid (2.0 M, 1.0 M, 0.5 M, 0.1 M)Sodium hydroxide (2.0 M, 1.0 M, 0.5 M, 0.1 M)4.0Procedure:1.10mL each of the acid solution and hydroxide solution (as per Figure 4.1) was measured for reaction mixture 1.
 Canister of lye (sodium hydroxide)
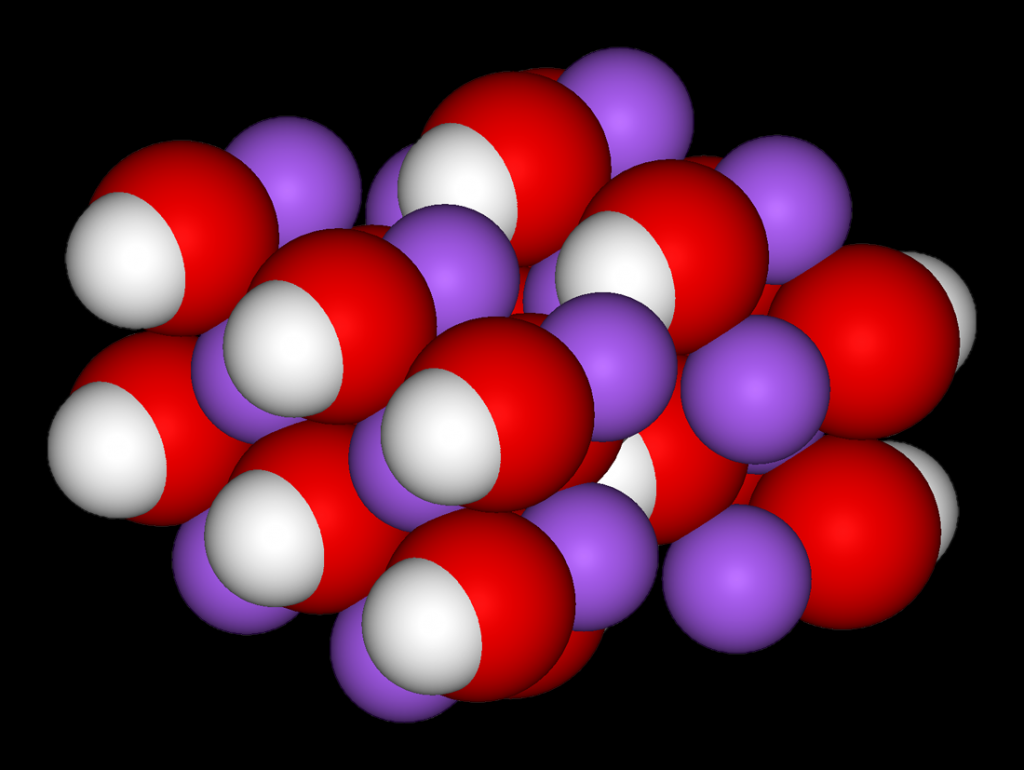 Unit cell, spacefill model of sodium hydroxide
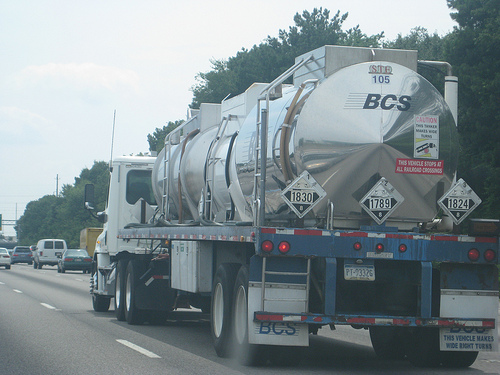 Hazmatspotting: UN 1789, "Hydrochloric acid"; UN 1...
2.The acid solution was pored into a test tube where its temperature was measured and recorded (Figure 5.2).
3.10mL of hydroxide solution was added to the acid, whilst stirring gently. The maximum temperature reached was recorded.
4.The temperature increase was calculated and recorded.
5.Steps 1-4 were repeated once more where a constant temperature was reached, and twice more if not. The average temperature increase was calculated and recorded from this data.
6.Steps 1-5 were repeated for each reaction mixture.
7.The amount of water (in moles) formed from the reaction between hydrogen and hydroxide ions in each reaction mixture was calculated and recorded.
Figure 4.1Reaction Mixture[H+] mol L-1[OH-] mol L-112221130.50.540.10.5520.560.525.0Results:Figure 5.1Results TableReaction MixtureAmount of H+(aq) (mol)Amount of OH-(aq) (mol)Amount of H2O formed (mol)Ti (úC)Tf ( úC)Temp. ChangeAverage Temp. Change10.020.020.0225úC34úC9úC10.5úC25úC35.5úC10.5úC25úC37úC12úC20.010.010.0124úC29.5úC5.5úC5.5úC23.5úC29úC5.5C30.0050.0050.00525úC28.5úC3.5úC3.5úC25úC28.5úC3.5úC40.0010.0010.00125.2úC26.1úC0.9úC0.7úC25.5úC26úC0.5úC50.020.0050.00525.5úC27úC1.5úC1.5úC25.5úC27úC1.5úC60.0050.020.00525úC28úC3úC3úC24úC27úC3úC24úC27úC3úCFigure 5.2Results GraphTask:Use the table/graph to deduce an average value of the molar...
The Relationship between Heat and Amount of Reaction
This is a quite interesting essay...
0 out of 0 people found this comment useful.