As securities analyst for Riordan Manufacturing Company, I was assigned the role to carefully analyze and compare their financial data. Utilizing both their income statement and balance sheet for its fiscal years 2003 and 2002, I was able to successfully conduct a Du Pont analysis and determine the Return on Equity for both years.
The initial step involved focusing on the the Du Pont system of analysis. Return on total assets as described through the two components of profit margin and asset turnover is part of the Du Pont system of analysis. The information provided for their 2002 fiscal year included their net income at $2510276 - this was divided by their sales of $43418370 which in turn gave us a profit margin of .057. The Sales figure was then divided by $35637504 (total assets) and provided us with the asset turnover of 1.218. The profit margin and asset turnover was then multiplied to give us the return on assets figure of .069.
 Assets
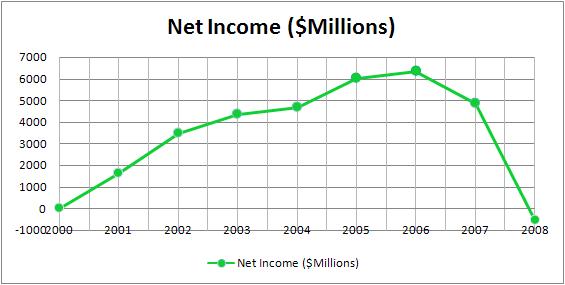 Net Income
 Sun-Rype Net Income
Also, by dividing the total debt of $14158976 with the total assets of $35637504 gave us the financing plan of .397. That number was subtracted from 1 and was used to divide into .069 to give us the Return of Equity as .114.
The 2003 year was also examined as well. The net income for this year was at $1990495 which was significantly lower than the previous year by nearly five million. But the sales figure was higher by nearly 3 million more. Therefore the 2003 year had a lower net income but a higher number in sales. This affected the profit margin, which led to the return on assets figure of .058. All together this led to the return on equity summing up to .090 which differed lower than 2002's .114.
One of the three questions...