PLEASE NOTE: This version is extremely unreadable, YOU MUST LOOK AT THE MS WORD DOC FILE.
Rocket Launch Portfolio
Mr. McAfee
Math 4/Block 1
7 February 2003
By: Ronald K. Ellis III
The Rocket Launch
As the shuttle STS-82 lifted off from the NASA launching pad at Cape Canaveral, Mission Control in Houston was receiving the following data about the vertical velocity of the rocket in feet/sec. We will use this information to give an estimate of the distance the rocket travels in its first 40 seconds.
Time since Launch(s) Velocity (ft/sec)
0
0
2.88
44
5.76
99
8.64
160
11.52
224
14.4
290
17.28
363
20.16
444
23.04
528
25.92
610
28.8
689
31.68
766
34.56
839
37.44
903
40.32
965
43.2
1027
46.08
1087
48.96
1146
a)Use the data to find the altitude of the rocket after 40.32s (assume the rocket is launched from sea level). Describe your steps and justify your conclusion.
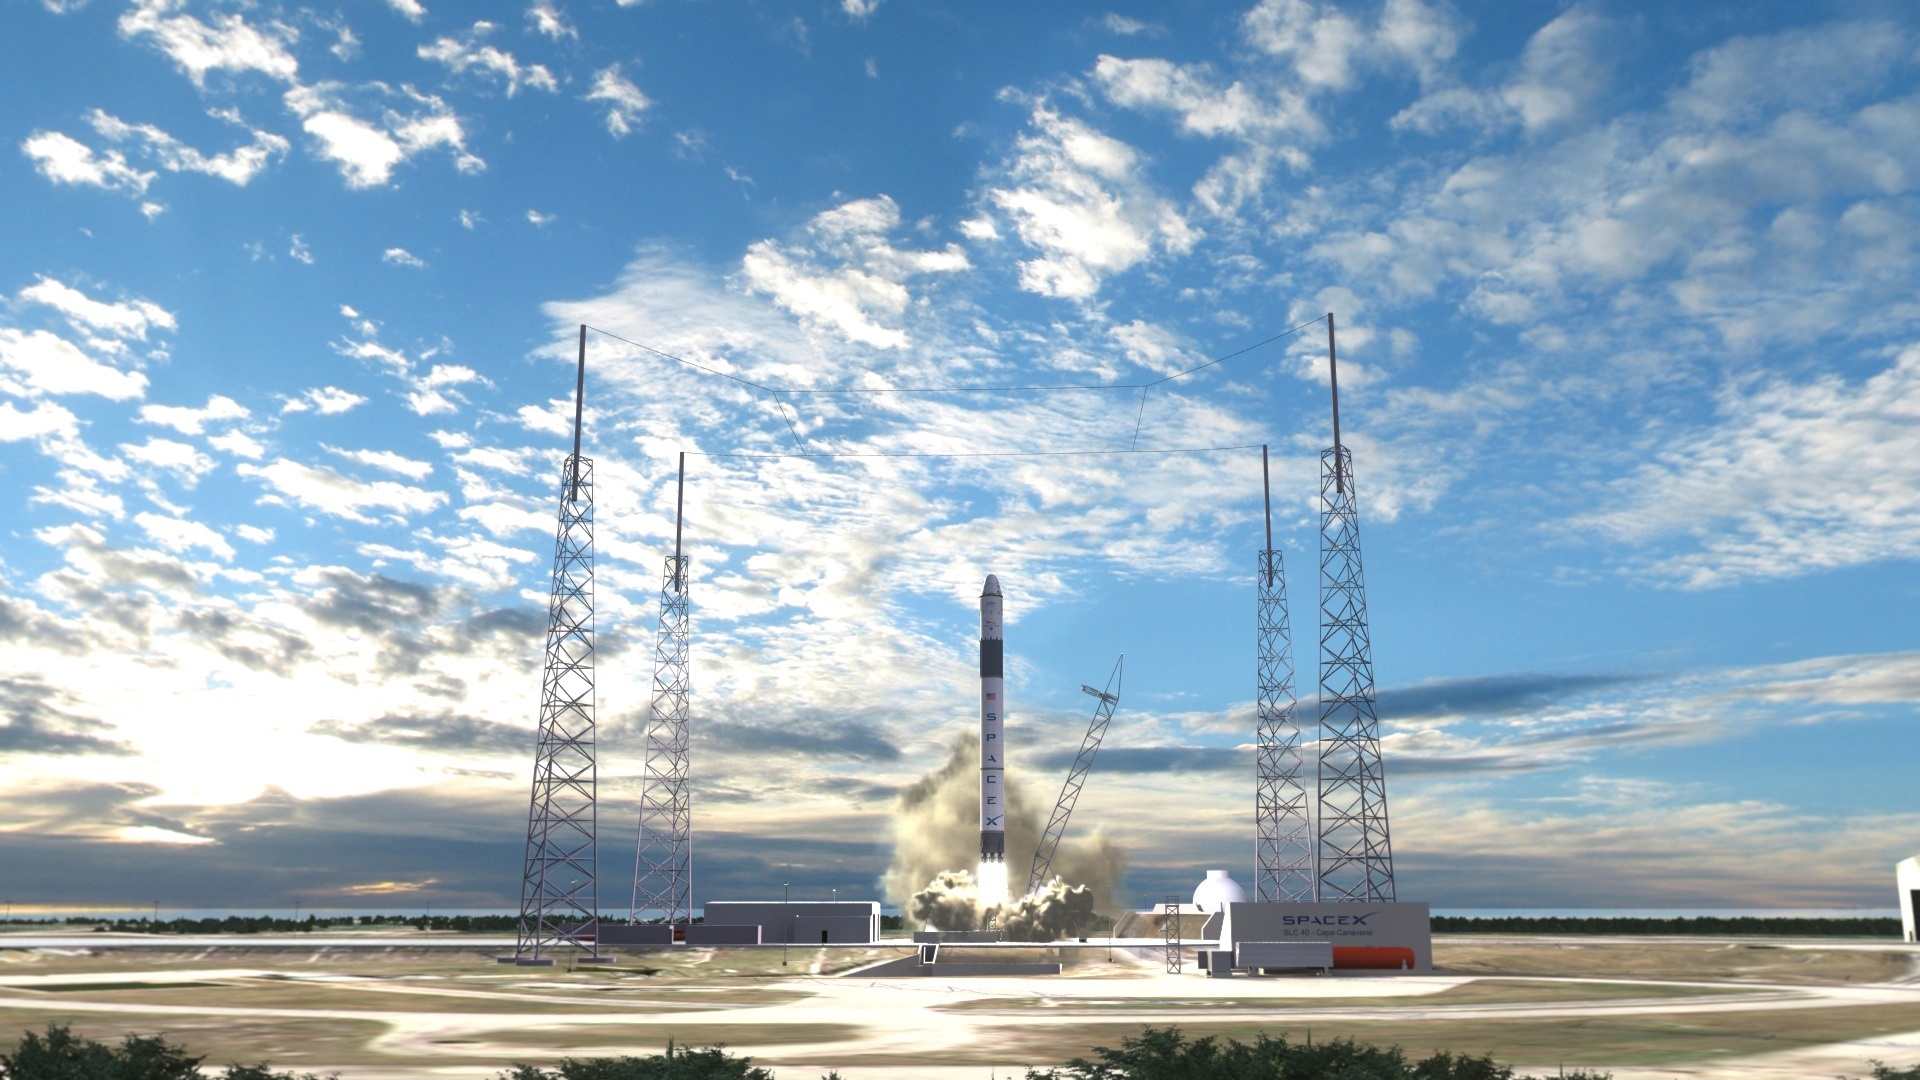 English: Computer simulation of SpaceX's Falcon 9 ...
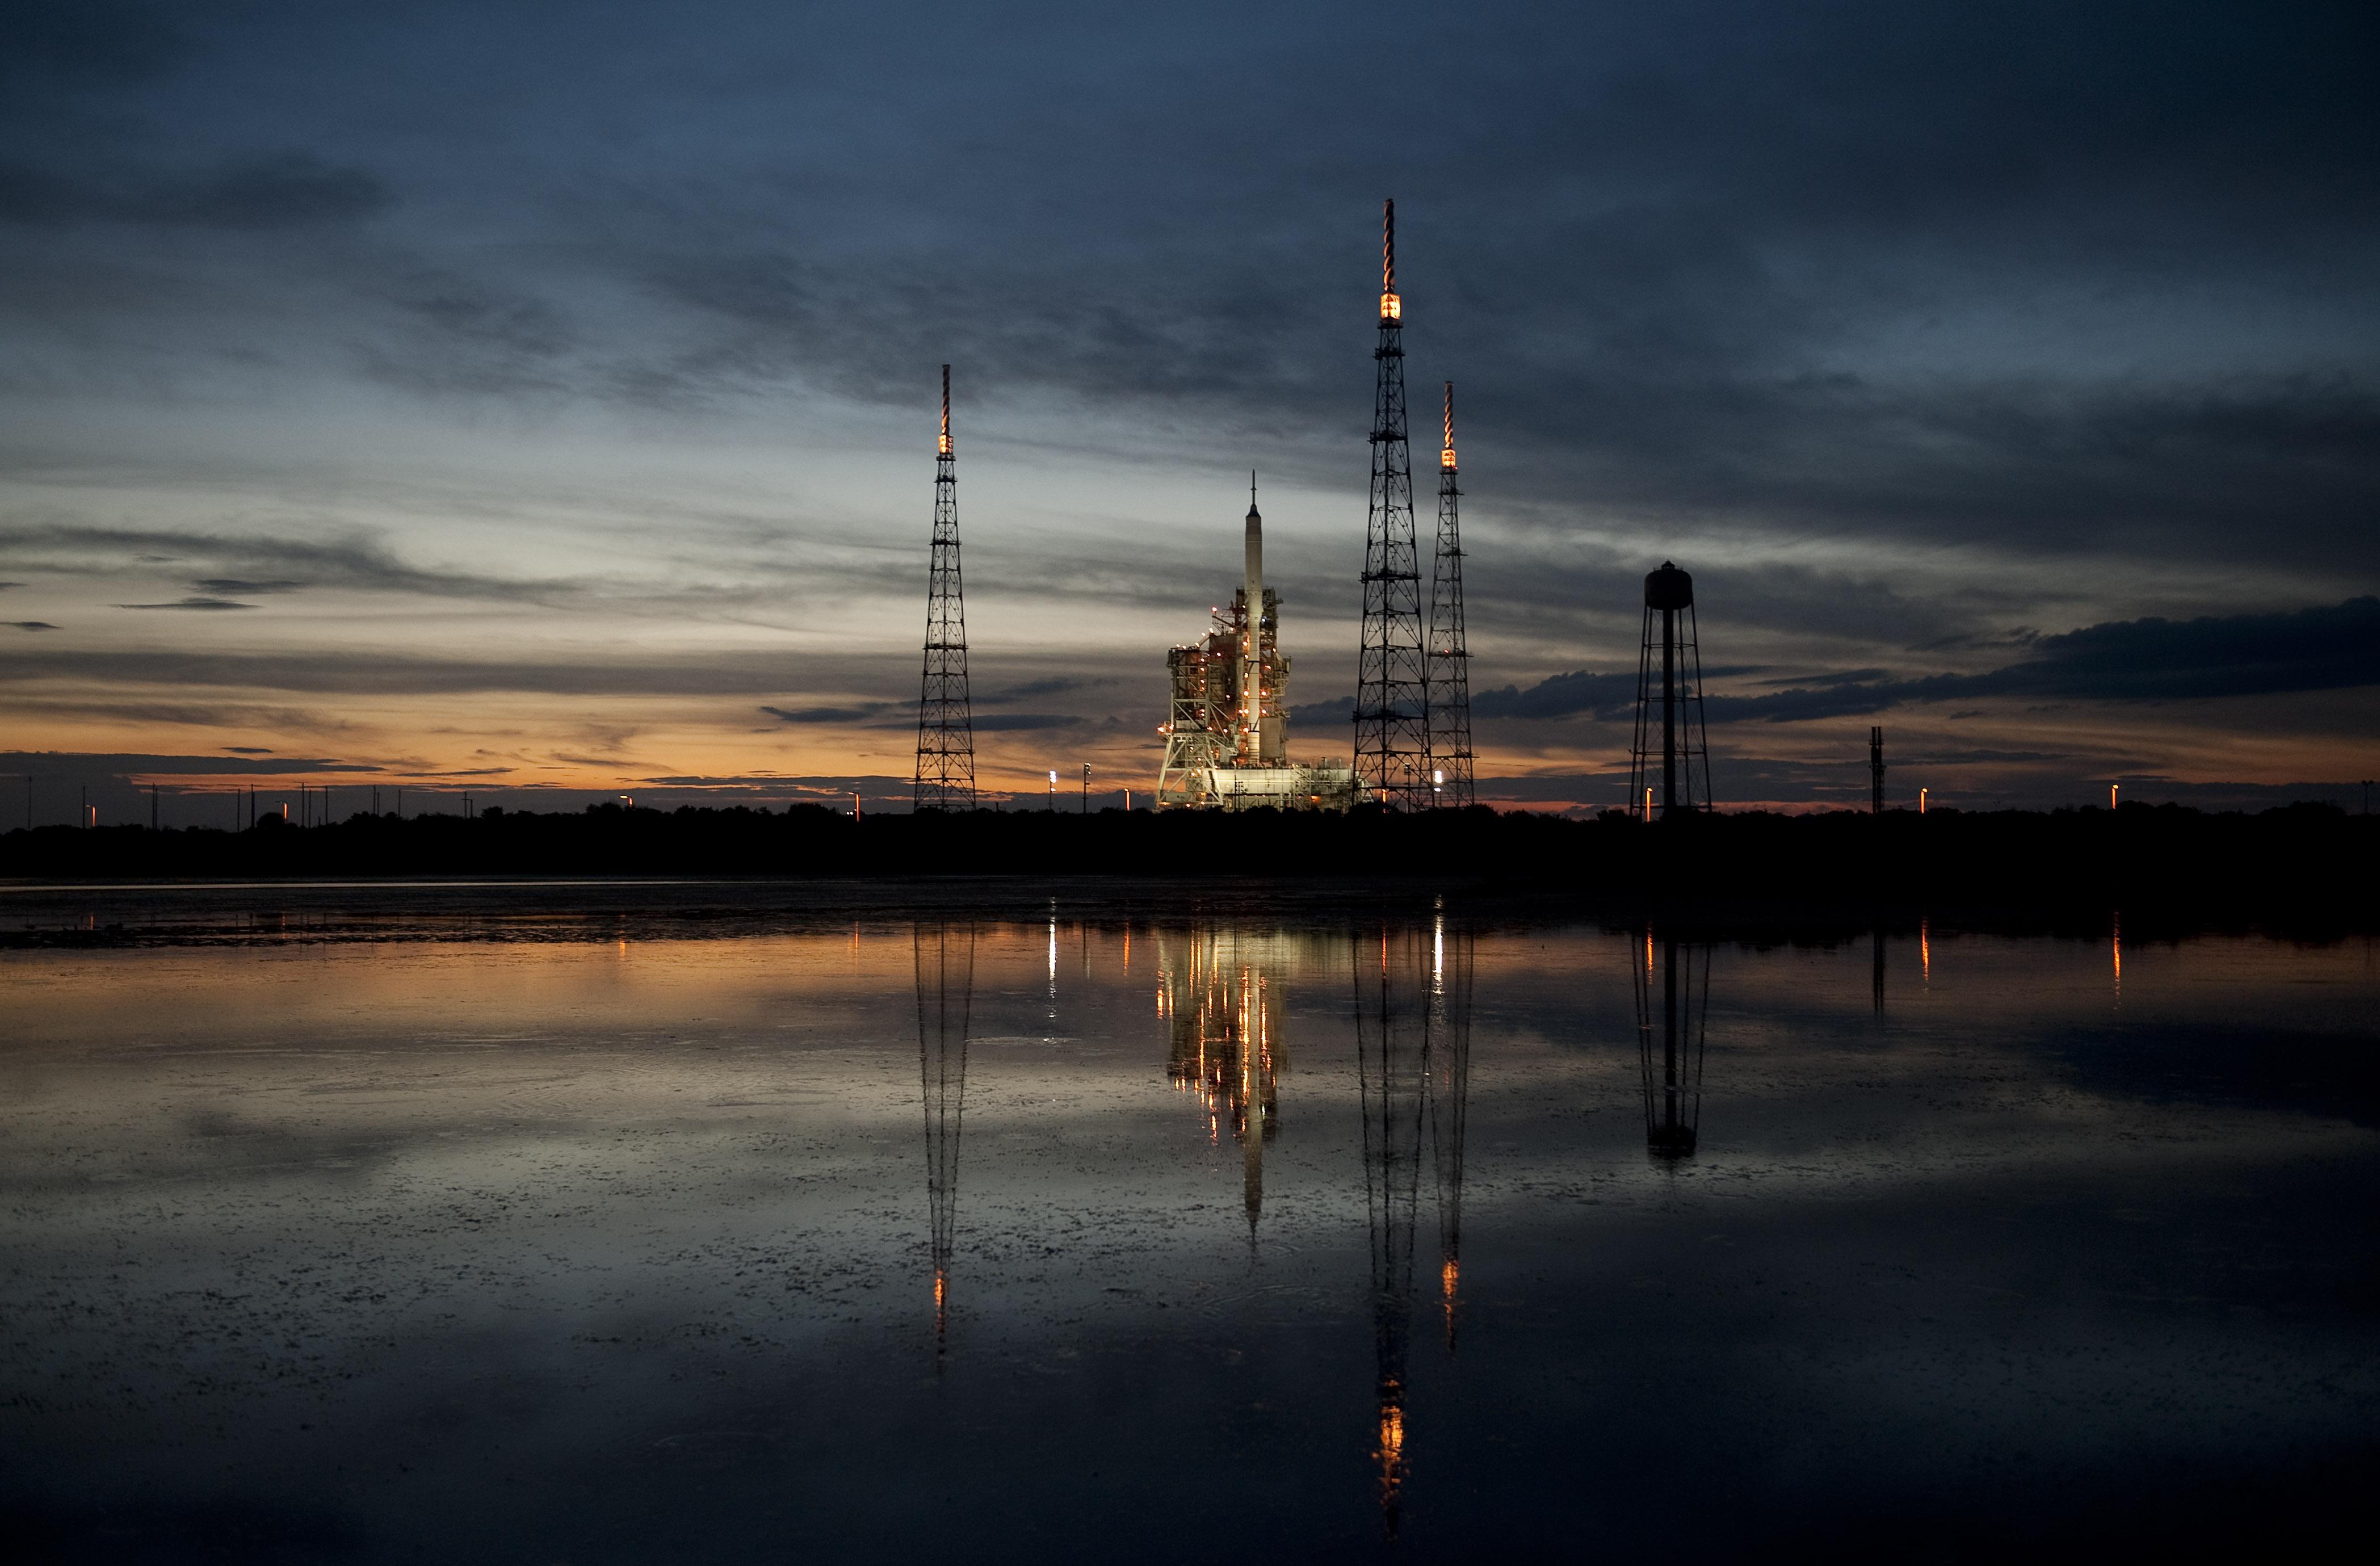 English: NASA's Ares I-X rocket is seen on Launch ...
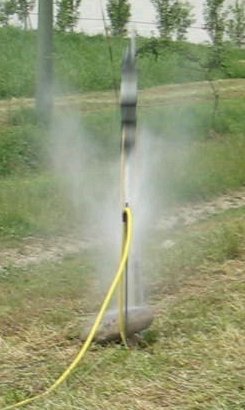 Launch of a water rocket
The blue area under the curve at a given time value is equal to the altitude at that same time.
Calculate the total altitude after 40.32s (Using trapezoid area approximation method)
Formulas-
Substituting in the rocket launch data to calculate area under curve at time index 40.32s
In this step I used the principle that the area underneath the data points at any given time index is equal to the total altitude at that same time index. This principle is proven when one multiplies the units the seconds unit cancels leaving only distance for an answer.
b) Use a full sheet of graph paper and graph the times up to 40.32 seconds. What is the pattern for the points that you found? Find an equation that matches the data as close as you can. (Assume a y-intercept of 0.)
The trend is an upward one taking...