I.INTRODUCTIONThis report outlines the analysis of two low-cost airlines performance in Europe, namely easyJet PLC and Ryanair Hldgs during their financial year between 2006 and 2008. It examines the companies' portfolio, future prospects and competitors to analyse the threats and opportunities facing their business. In conclusion, there is a recommendation whether to invest on easyJet and/or Ryanair's shares.
II.FINANCIAL AND NON-FINANCIAL RATIO ANALYSISIn terms of the completed financial analysis, there are several findings as follows:â¢Profitability Ratios highlight the operating performance from the generated profit. (Atrill & McLaney, 2008)Operating Profit MarginFigure 1. Operating Profit Margins (%)The graph shows that easyJet's operating profit margins declined sharply, reaching only 3.85% from 10.16% and this is moderately low, compared to the three-year average of 7.09%. Unlike easyJet, Ryanair has more stable profit margins, 21.01% on average. According to the figures, Ryanair seems more vigorous in generating higher profit from its sales, which was partially due to hotels, car rentals and other non-flight products selling.
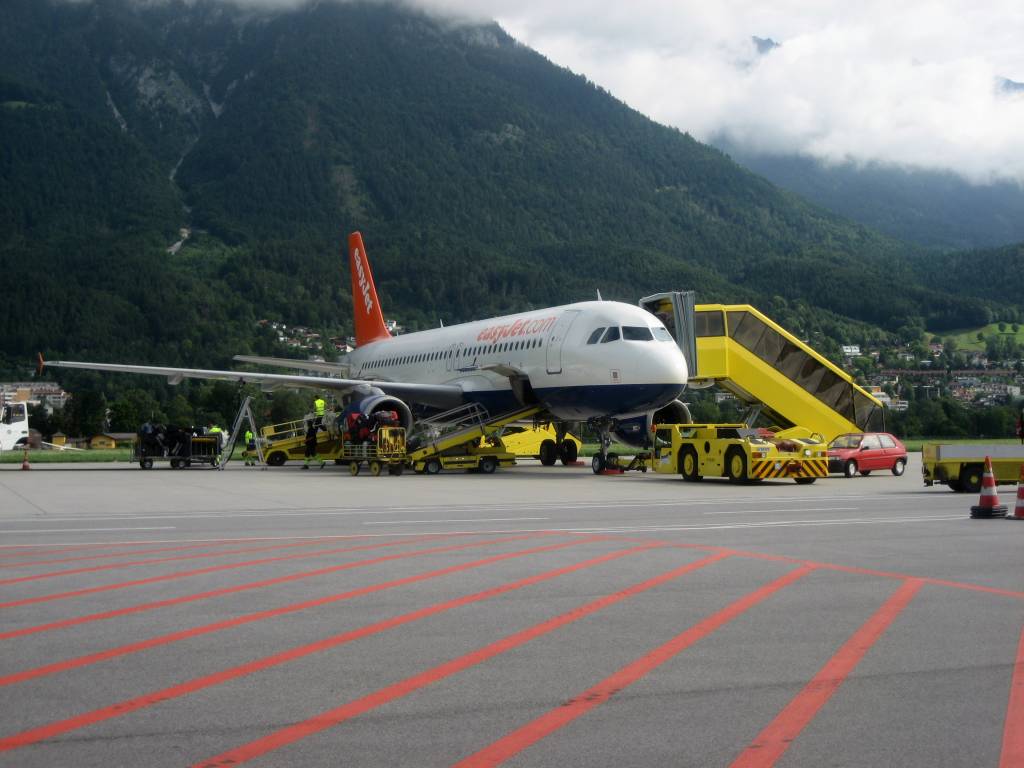 An easyJet A320, G-TTOC, prepares for departure at...
 English: I Took This Photo
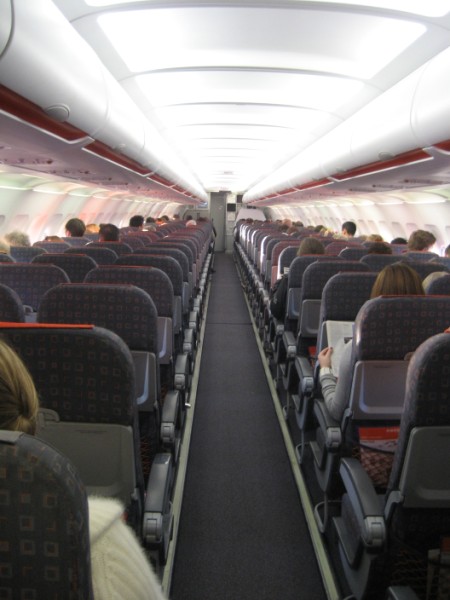 easyJet A319 Cabin
On the other hand, easyJet seems had been negatively affected by intense competition among its rivals as well as the price pressures.
Return on Capital EmployedFigure 2. Return on Capital Employed (%)The ROCE shows the performance of business in generating profit to its long-term capital suppliers. (Atrill & McLaney, 2008) The highest ROCE ratio, 10.41% in 2007 specifies that easyJet had a better performance by fully using its assets in generating revenues. However, the ROCE slid dramatically to only 4.46%, which indicates a weak performance because its return on assets was probably below its cost of capital. In terms of overall ROCE, Ryanair had a higher margin, 11.19%, than easyJet, 7.73%. From this figure, it is suggested that easyJet should operate at Ryanair's significant discount.
Return on Shareholders' FundFigure 3. Return on Shareholders' FundIn terms of the overall ROSF, the shareholders' in Ryanair were more beneficial than those in easyJet as they gained higher return. This is showed by the average ROSF of 17.06% compared to only 10.43% from easyJet, meaning the investment made by shareholders in Ryanair was more profitable than in easyJet.
Gross Profit MarginFigure 4. Gross Profit Margin (%)There was an insignificant decline in GPM for both companies. It is presumably owing to the increased operating expenses as a result of the rise in fuel costs and extensive price competition.
â¢Efficiency Ratios highlight how the business resources have been utilised efficiently. (Atrill & McLaney, 2008)Assets TurnoverFigure 5. Asset Turnover (point)The rate of asset turnover for easyJet and Ryanair increased gradually for the last three years. This, in essence, means that they had a better return corresponding to their net assets. However, easyJet's asset turnover dropped slightly from 1.14 to 1.02, but recovered to 1.16 point in 2008. On the other hand, Ryanair showed a consistent asset turnover even though its points were lower than easyJet's. It is clearly seen that Ryanair was capable of translating its assets into constant increased sales revenue over the last three years.
Creditor DaysFigure 6. Creditor DaysIn comparison to the average creditor days for both companies, it is thought that the trade payable account had a minor impact on Ryanair. Unlike Ryanair, easyJet seems had been more beneficial because it used the free finance from its suppliers to buy its inventories and then repay them back within quite a long time.
Debtor DaysFigure 7. Debtor DaysAccording to the figures, Ryanair's customers needed less than 6 days to fulfil their payment. Indeed, easyJet's customers needed more than 40 days on average to pay the company. It could be assumed that easyJet tried to attract more travellers by providing a better payment facility.
â¢Liquidity Ratios measure how companies could pay the debt. (Atrill & McLaney, 2008)Ryanair easyJetThe liquidity ratios for Ryanair and easyJet were relatively the same as their stocks play an insignificant role. Current and quick ratios tended to stay at the same level as both companies do not hold any psychical production stocks. An average current and quick ratio of 2.02 for the last three years indicates that Ryanair appeared to be more capable of covering and repaying its short-term debts and obligations. Overall, both companies did not experience any problems in terms of liquidity because their current assets were able to cover the current liabilities.
â¢Financing Ratios show how companies finance their business whether from shareholders' funds or debts. (Atrill & McLaney, 2008)Gearing RatioFigure 8. Gearing RatiosRyanair showed a higher leveraging on its balance sheet, 46.48% on average, than easyJet, 39.95%. It is partly because the borrowed money was mainly used in investing new aircrafts or launch new range of routes. This led to higher returns to shareholders' equity in Ryanair rather than in easyJet.
Interest Cover RatioFigure 9. Interest Cover RatiosFrom the figures above, Ryanair was able to generate high operating profits to cover its interest expenses as can be seen by the high interest coverage ratio on average of 5.43. However, the interest cover ratio of easyJet slid to only 2.68, which was particularly caused by a dramatic fall in the profit for the year from ã 152.3 million to ã 83.2 million.
â¢Investment Ratios assist investors in assessing their return on the made investment. (Atrill & McLaney, 2008)easyJet relies on a free cash flow financing to further its growth. As a result, easyJet pays no dividends. The same dividend policy is also followed by Ryanair.
The last released PER in 2008 indicates that Ryanair, which expected to have a good growth prospect, was traded at a lower price, 20.16, in comparison to easyJet at 24.33. This shows that easyJet was traded more expensive relative to Ryanair.
Non-financial terms such as the traffic growth, the number of employees, load factor, number of routes and aircrafts could also affect the business greatly apart from financial ratios. They help companies identify trends for future performance. For instance, the load factors for both companies remained stable over the last three years. However, Ryanair achieved 82% in load factors while easyJet stood at 84.1%. This figure illustrates that easyJet was able to fill its planes slightly better than Ryanair.
III.THREATS AND OPPORTUNITIES ANALYSISMain threats:â¢Oil price fluctuationFuel is a significant cost to easyJet and Ryanair. In 2007, the average fuel price was $65/barrel, but today, it is $130/barrel. In this case, easyJet could be more vulnerable in facing the rise of fuel price. However, Ryanair offers no fuel surcharges to its customers. (Ryanair Annual Report, 2008)Therefore, Ryanair stimulates that many passengers will switch to travel by their flights to avoid higher prices as a consequence of additional fuel surcharges from other low-cost airlines.
â¢Terrorism or security threat on the aviation industry may cause a loss of key national infrastructure and a rise in safety and security cost measures. (Ryanair Annual Report, 2006)â¢Market competitionA rise in competition could lead to a saturated market as many low-fare new entrants are entering the market such as 'bmibaby'. This will also result in a complexity in getting low fees support in some airports.
Main opportunities:â¢Customers are price sensitive. (easyJet and Ryanair Annual Reports, 2008)The slowdown in the economy will definitely lead the customers to seek lower fares airlines. This means that there will be a rise in passenger volumes.
â¢Market expansionEuropean Union enlargements could let both companies to have opportunities to expand and open up new destinations. (easyJet and Ryanair Annual Reports, 2008)In addition, potential market such as Asia contains many potential opportunities because it has a very huge population and immigrant inflows are on the rise.
â¢Business-to-business corporationeasyJet could have additional source of income generated from its easyJet Academy. In addition, it could corporate with other easy businesses such as easyCar as well as easyFinance. (easyJet Annual Report and Accounts, 2008) . This could also increase the trades in 'easy' businesses.
However, Ryanair could corporate with travel agencies, as this would bring another business opportunity. Many travel agencies nowadays have Europe trips that could increase the flying demands.
IV.RECOMMENDATIONGiven to the persistent differences in both financial and non-financial ratios, I could offer recommendation to invest in Ryanair. There are two methods used in analysing the shares:â¢In terms of fundamental metrics such as the ROCE and operating margin, Ryanair shows better performance than easyJet. Ryanair has a gradual increase in its return on capital. Similar conclusion could be drawn from its Price-to-Book and PE ratios. A 2.13 PBT illustrates that investors are more willing to pay higher price for Ryanair than for easyJet with only 1.03 . In addition, a PER of 24.33 showed that the price paid for easyJet is more expensive. Therefore, I remain cautious about easyJet's share price perspective and would recommend Ryanair indeed.
â¢Technically, Ryanair's trading prices are principally more stable rather than easyJet. This shows that shares in Ryanair are actively traded as many investors see the future prospect of Ryanair could be better than easyJet.
However, if I personally had ã50,000, I would not have them invested on shares considering the unstable and unpredictable market. We know that all businesses create risks. The more the risk, the higher return we will get. Investing on shares is a 'high risk, high gain' and a long-term portfolio. Therefore, I would prefer to invest on properties or becoming sole trader instead of investing on shares because shares will not give returns in short-term period, moreover they are risky.
V.REFERENCESAtrill. P. & McLaney.E. 2008. Accounting and finance for non-specialists sixth edition. London. Prentice HallDictionary (2009). Price-To-Book Ratio - P/B Ratio [online]. Available from http://www.investopedia.com/terms/p/price-to-bookratio.asp (Accessed on 14 April 2009)easyJet company website (2009). Annual Reports and Accounts 2006 [online]. Available from http://www.easyjet.com (Accessed on 1 April 2009)easyJet company website (2009). Annual Reports and Accounts 2007 [online]. Available from http://www.easyjet.com (Accessed on 1 April 2009)easyJet company website (2009). Annual Reports and Accounts 2008 [online]. Available from http://www.easyjet.com (Accessed on 1 April 2009)easyJet LSE:EZJ (2009). EasyJet Company Information [online]. Available from http://www.advfn.com/p.php?pid=ukfinancials&symbol=LSE%3AEZJ (Accessed on 15 April 2009)London Stock Exchange website (2009). RYA RYANAIR HOLDINGS PLC ORD EUR0.00635 [online]. Available from http://www.londonstockexchange.com/en-gb/pricesnews/prices/System/DetailedPrices.htm?sym=IE00B1GKF381IEEURSET2B1GKF38RYA#PriceChart (Accessed on 14 April 2009)London Stock Exchange (2009). EZJ EASYJET PLC ORD 25P [online]. Available from http://www.londonstockexchange.com/en-gb/pricesnews/prices/system/detailedprices.htm?sym=GB0001641991GBGBXSET 20164199EZJ (Accessed on 14 April 2009)Ryanair Holdings Plc ADS NASDAQ:RYAAY (2009). Ryanair Company Information [online].Available from http://www.advfn.com/p.php?pid=financials&symbol=NASDAQ%3ARYAAY (Accessed on 15 April 2009)Ryanair company website (2009). Annual Reports and Financial Statements 2006 [online]. Available from http://www.ryanair.com (Accessed on 1 April 2009)Ryanair company website (2009). Annual Reports and Financial Statements 2007 [online]. Available from http://www.ryanair.com (Accessed on 1 April 2009)Ryanair company website (2009). Annual Reports and Financial Statements 2008 [online]. Available from http://www.ryanair.com (Accessed on 1 April 2009)Ryanair company website (2009). 3rd Quarter Results 2009 [online]. Available from http://www.ryanair.com (Accessed on 1 April 2009)