The experiment must fulfill two goals: (1) to produce a professional report of your experiment, and (2) to show your understanding of the topics related to least squares regression as described in Moore & McCabe, Chapter 2. In this experiment, I will determine whether or not there is a relationship between average SAT scores of incoming freshmen versus the acceptance rate of applicants at top universities in the country. The cases being used are 12 of the very best universities in the country according to US News & World Report. The average SAT scores of incoming freshmen are the explanatory variables. The response variable is the acceptance rate of the universities.
I used September 16, 1996 issue of US News & World Report as my source. I started out by choosing the top fourteen 'Best National Universities'. Next, I graphed the fourteen schools using a scatterplot and decided to cut it down to 12 universities by throwing out odd data.
 Linear regression scatterplot with formula
 Linear-regression
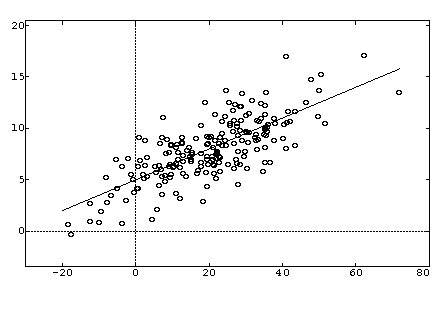 Linear regression
A scatterplot of the 12 universities data is on the following page (page 2)
The linear regression equation is:
ACCEPTANCE = 212.5 + -.134 * SAT_SCORE
R= -.632 R^2=.399
I plugged in the data into my calculator, and did the various regressions. I saw that the power regression had the best correlation of the non-linear transformations.
A scatterplot of the transformation can be seen on page 4.
The Power Regression Equation is
ACCEPTANCE RATE=(2.475x10^23)(SAT SCORE)^-7.002
R= -.683 R^2=.466
The power regression seems to be the better model for the experiment that I have chosen. There is a higher correlation in the power transformation than there is in the linear regression model. The R for the linear model is -.632 and the R in the power transformation is -.683. Based on R^2 which measures the fraction of the variation in the...