Box Plot and whiskers
In descriptive statistics, a box plot or boxplot is a convenient way of graphically depicting groups of numerical data through their quartiles. Box plots may also have lines extending vertically from the boxes (whiskers) indicating variability outside the upper and lower quartiles, hence the terms box-and-whisker plot and box-and-whisker diagram. Outliers may be plotted as individual points.
Box plots display variation in samples of a statistical population without making any assumptions of the underlying statistical distribution: box plots are non-parametric. The spacing's between the different parts of the box indicate the degree of dispersion (spread) and skewness in the data, and show outliers.
Advantages and disadvantages
Handles large data easily - Due to the five number data summary, a box plot is able to handle and present a summary of a large amount of data. A box plot consists of the median, which is the midpoint of the range of data; the upper and lower quartiles, which represent the numbers above and below the highest and lower quarters of the data; and the minimum and maximum data values.
 English: Nishiguchi. Boxplot and a probability den...
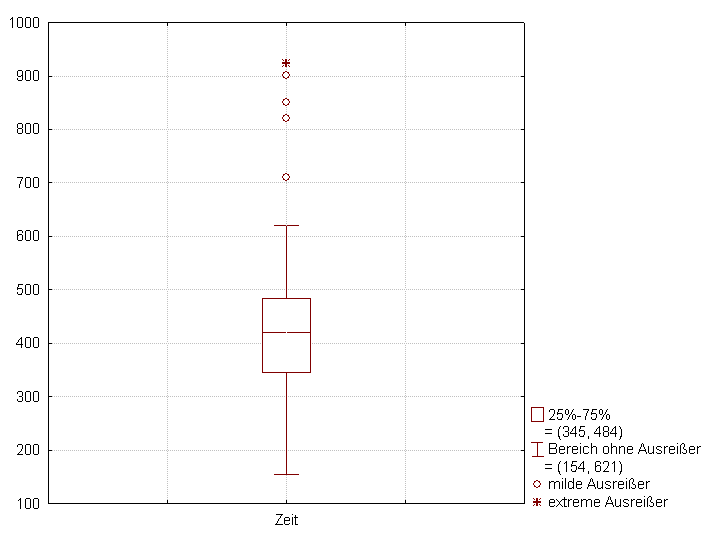 English: Plot of a Box-Plot with Whiskers to 1.5 i...
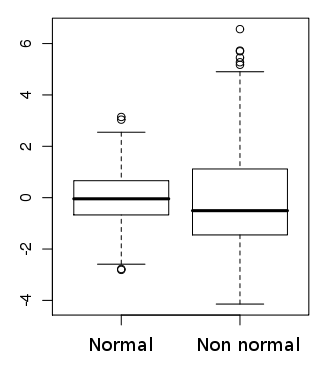 English: box-plot of normal and no normal distribu...
Organizing data in a box plot by using five key concepts is an efficient way of dealing with large data that is too unmanageable for other graphs, such as line plots or stem and leaf plots.
Exact value not retained - The issue with handling such large amounts of data in a box plot is that the exact values and details of the distribution of results are not retained. A box plot shows only a simple summary of the distribution of results, so that it can be quickly viewed and compared with other data. For a thorough, more detailed analysis of data a box plot should be used in combination with another statistical graph...