Assignment 1
Q10. Read the comparative statement of financial position and the statement of financial performance of Imaginary Computers Limited. Prepare a credit assessment report using the techniques of financial statements analysis as explained in this chapter. Comment on the financial strengths and weaknesses of the firm.
Imaginary Computers Ltd.
Statement of financial position
as at 31 December ($ '000) (Balance sheet)
2001 | 2002 | 2003 | |
Share capital | 5.3 | 7.5 | 8.5 |
Reserves and surplus | 6.7 | 5.7 | 7.4 |
Long-term debt | 4.1 | 3.2 | 4.2 |
Short-term bank borrowing | 5.6 | 5.2 | 7.2 |
Current liabilities | 3.4 | 6.5 | 5.6 |
Total | 25.1 | 28.1 | 32.9 |
Net fixed assets | 17.4 | 21.8 | 26.1 |
Cash at bank | 2.6 | 0.8 | 1.2 |
Receivables | 3.5 | 2.8 | 2.9 |
Other assets | 1.6 | 2.7 | 2.7 |
Total | 25.1 | 28.1 | 32.9 |
Imaginary Computers Ltd
Statement of financial performance
for the year ending 31 December ($ '000) (Income statement)
2001 | 2002 | 2003 | |
Net Sales | 29.8 | 34.9 | 57.4 |
Cost of goods sold | 24.5 | 26.2 | 45.8 |
Gross Profit | 5.3 | 8.7 | 11.6 |
Operating Expenses | 3.7 | 4.2 | 7.0 |
Operating profit | 1.6 | 4.5 | 4.6 |
Non-operating surplus/deficit | 0.2 | 0.1 | 0.4 |
EBIT | 1.8 | 4.6 | 5.0 |
Interest | 1.0 | 0.9 | 2.0 |
Profit before tax | 0.8 | 3.5 | 3.0 |
Tax | 0.6 | - | |
Profit after tax | 0.8 | 2.9 | 3.0 |
Dividends | 0.6 | 0.6 | 1.1 |
Retained earnings | 0.2 | 2.3 | 1.9 |
A.10: Trend of ratios and interpretation thereof
Ratio | Formula | 2001 | 2002 | 2003 | Comments | |
Liquidity ratio | Current ratio | 1.79 | 0.55 | 0.73 | Lower than benchmark, declining trend. Shows liquidity problems | |
Quick Ratio | 0.76 | 0.12 | 0.21 | Same as above | ||
Efficiency ratios | Inventory turnover ratio | Can't be calculated as figures of inventory are not available | ||||
Average collection period | 43 | 29 | 19 | Shows collection efficiency has improved | ||
Profitability ratio | Gross Profit/sales | 0.05 | 0.12 | 0.08 | Needs to be compared to industry trends. Not very favourable | |
Net profit/sales | 0.03 | 0.08 | 0.05 | Same as above | ||
Leverage ratios | Debt to equity ratio | 1.09 | 1.12 | 1.07 | Shows high stake of proprietors in business. Good indication | |
Interest coverage ratio | 1.8 | 5.11 | 2.5 | Good. Shows that firm will have no problems in paying interest. | ||
Fixed charges ratio | Can't be calculated as relevant figures are not available |
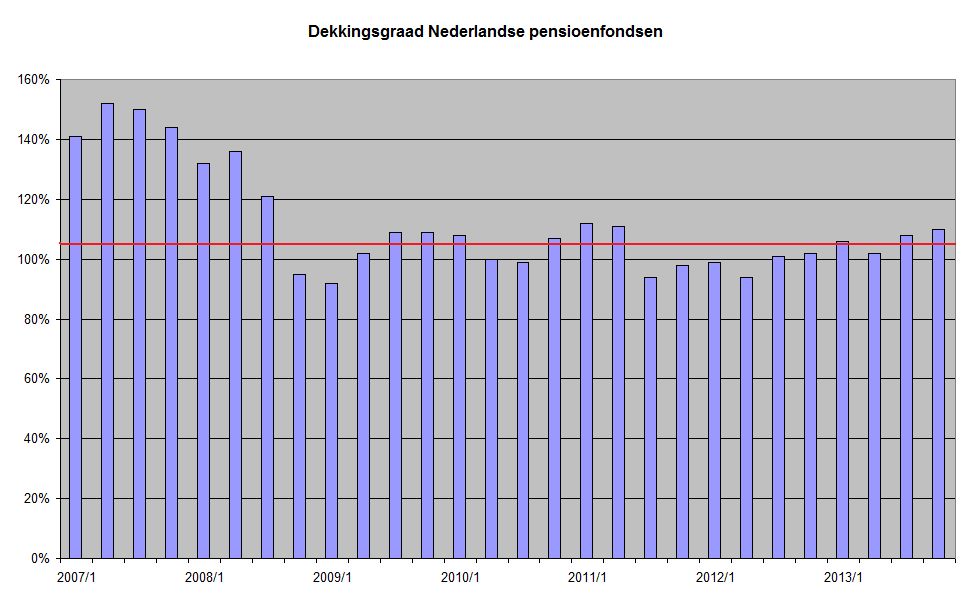 Coverage ration of Dutch pension funds from 2007, ...
 Quick Ratio - wzór
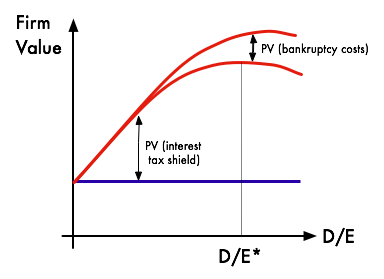 Trade Off theory diagram