U.S. Hispanic Groups: Analyzing identity the United States is comprised of more ethnic groups than any other country in the world. The largest non-white ethnic group in the United States is Hispanic. The Hispanic population makes up 13 percent of the total United States population. The following is a comparison of four Hispanic groups living in the United States; Cuban, Mexican, Puerto Rican and Central and South Americans. This report will analyze major areas of each group's lives and how that all relates to how they identify with their home culture and their assimilation into United States culture.
Of the Hispanic groups in the United States, there are several areas in which they are alike, as well as different. This report will go over each group independently then summarize the areas in which the groups are alike and different.
 Soldiers of the 65th Infantry training in Salinas,...
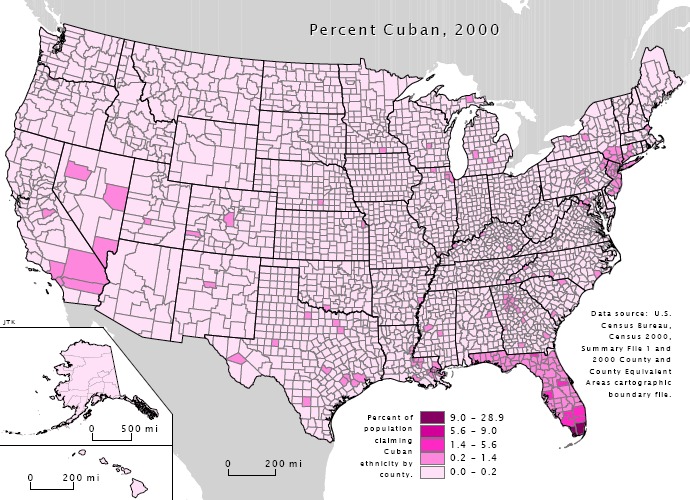 English: Diagram indicating Cuban American settlem...
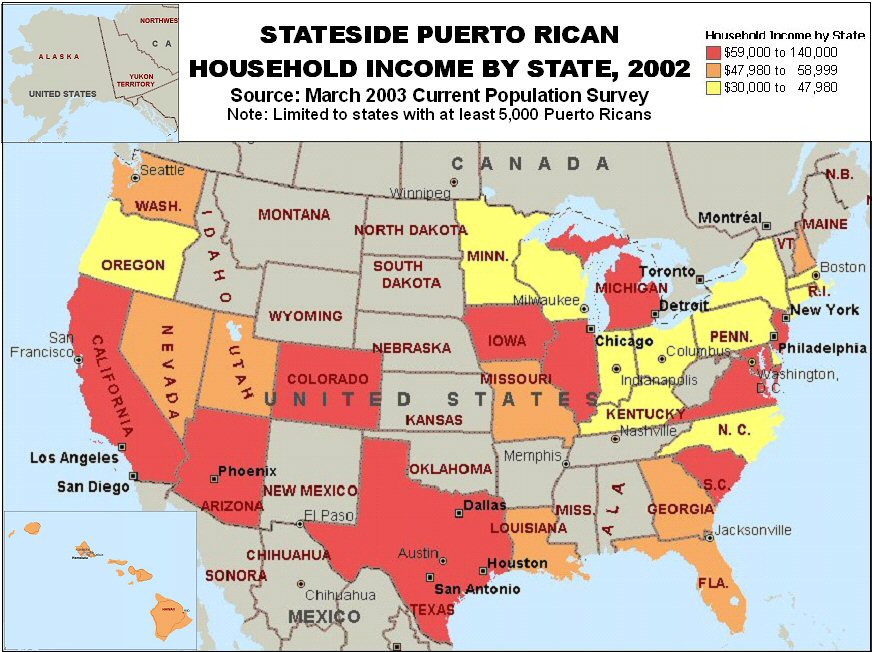 graphic by Angelo Falcón
Cuban Americans:Cuban Americans are typically the most financially successful of the Hispanic groups in the United States. They have a higher median income, a higher rate of home ownership, and a lower poverty level than do other Hispanic groups in the United States.
In education, they are second in high school completion and are about equal with Puerto Ricans in having a bachelor's degree or more.
Cuban Americans also have a higher rate of divorce than do other Hispanic groups in the United States, even though their marriage rate is lower. They are ranked second in family housing and living situations behind Mexicans.
Living arrangements among Cubans, while predominantly familial, also tend to be non-family members of the same group. Cubans are ranked second in this category.
Politically the majority are democratic, however they do hold the second highest rate of affiliation with the republican party out of the Hispanic groups in the United States. The highest is in the Spaniard group.
Religion among the Cuban Hispanic group in the United States is predominantly Catholic, as with all other Hispanic groups in the United States. Cubans maintain strong ties within their religious and social groups. As with other Hispanic groups, religion tends to be their major area of socialization.
Cubans in the United States have the highest rate of Spanish speaking homes, but English spoken very well. They have a very low rate of English only homes, but a fairly high percentage of English spoken very well homes.
Puerto Ricans:Puerto Ricans family structures have the lowest percentage of two parent homes out of all Hispanic groups in the United States. They have high percentages in both matriarchal (single mother) families and non-family living arrangements.
Puerto Ricans have the highest number of English only speaking homes among the Hispanic groups in the United States. They also are much higher in Spanish at home, but English spoken very well homes in this group. They have the lowest average out of all the Hispanic groups in the united states of Spanish only and none or poor English speaking homes.
In education, Puerto Ricans have a high rate of bachelor's degrees or more, but a lower rate of high school completion than Cubans or Central and South Americans.
Mexican Americans:Of all the Hispanic groups in the United States, Mexicans have the highest percentage of two parent homes. They maintain a tight family structure and often have multiple generations living in one home.
Mexicans in the United States have the second highest rate of English only homes among the groups. They are also second in Spanish, with very poor or no English in the home. Interestingly, even though they are second in this area, they are almost statistically double in percentage thank Puerto Ricans.
Central/South Americans:Central and South Americans are in a close third behind Cuba in two parent living situations and have a high percentage of non-family member Hispanic households.
Central and South Americans have the highest number of Spanish speaking, non-English or very poor English speaking homes out of all the groups. Broken down, Central Americans statistically stick with their native tongue more so than South Americans.
South Americans have a higher rate of education in both high school completion and in having a bachelors degree or more.