Continuous random variable
measured (not counted)
takes any value within a given interval
ä¸ä¸ªéæºåéå¨å ¶åºé´å å½è½å¤åä»»ä½æ°å¼æ¶æå ·æçåå¸ã
Continuous Probability Distribution
The distribution of a continuous random variable
No gaps within the interval
Normal Distribution
Bell-shaped
Symmetrical
Mean=median=mode
Location is determined by the mean, μ
μå³å®æ£ææ²çº¿çä¸å¿ä½ç½®
uåæ¢ï¼ä¸ºäºä¾¿äºæè¿°ååºç¨ï¼å¸¸å°æ£æåéä½æ°æ®è½¬æ¢ãμæ¯æ£æåå¸çä½ç½®åæ°ï¼æè¿°æ£æåå¸çéä¸è¶å¿ä½ç½®ãæ£æåå¸ä»¥X=μ为对称轴ï¼å·¦å³å®å ¨å¯¹ç§°ãæ£æåå¸çåæ°ãä¸ä½æ°ãä¼æ°ç¸åï¼åçäºÎ¼ã
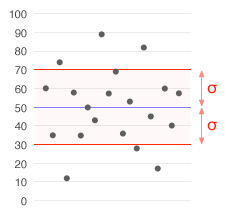
Spread is determined by the standard deviation, Ï
æ åå·®Ïå³å®æ£ææ²çº¿çé¡å³ææå¹³ç¨åº¦ãÏè¶å°ï¼æ²çº¿è¶é¡å³ï¼Ïè¶å¤§ï¼æ²çº¿è¶æå¹³ã
Ïæè¿°æ£æåå¸èµææ°æ®åå¸ç离æ£ç¨åº¦ï¼Ïè¶å¤§ï¼æ°æ®åå¸è¶åæ£ï¼Ïè¶å°ï¼æ°æ®åå¸è¶éä¸ãä¹ç§°ä¸ºæ¯æ£æåå¸çå½¢ç¶åæ°ï¼Ïè¶å¤§ï¼æ²çº¿è¶æå¹³ï¼åä¹ï¼Ïè¶å°ï¼æ²çº¿è¶ç¦é«ã
The random variable has an infinite theoretical range:
to +
The formula for the normal probability density function:
Where
X = any value of the continuous variable
μ = the population mean
Ï = the population standard deviation
e = the mathematical constant approximated by 2.71828
Ï = the mathematical constant approximated by 3.14159
æ£æåå¸åæ£å¤ªæ²çº¿
å¦ææ»ä½å¯åº¦æ²çº¿æ¯æè è¿ä¼¼æ¯å½æ°
çå¾åï¼å ¶ä¸åå«è¡¨ç¤ºæ»ä½çå¹³åæ°ï¼åæ åå·®ï¼è¿ä¸ªæ»ä½æ¯ææ é容éçæ½è±¡æ»ä½ï¼å ¶åå¸å«ä½æ£å¤ªåå¸ï¼è®°ä½Nï¼ï¼
å½æ¶ï¼å½æ°
对åºçæ»ä½ç§°ä¸ºæ åæ£å¤ªæ»ä½ï¼è®°ä½N(0,1)
Ïæè¿°æ£æåå¸èµææ°æ®åå¸ç离æ£ç¨åº¦ï¼Ïè¶å¤§ï¼æ°æ®åå¸è¶åæ£ï¼Ïè¶å°ï¼æ°æ®åå¸è¶éä¸ãä¹ç§°ä¸ºæ¯æ£æåå¸çå½¢ç¶åæ°ï¼Ïè¶å¤§ï¼æ²çº¿è¶æå¹³ï¼åä¹ï¼Ïè¶å°ï¼æ²çº¿è¶ç¦é«ã
æ åæ£å¤ªåå¸è¡¨
ï¼X0ï¼ï¼P(X<XO) 表示æ»ä½åå¼å°äºx0çæ¦ç
ä¸æ ¹æ®å¯¹ç§°æ§å¯å¾
ï¼X0ï¼ï¼1-ï¼ï¼X0ï¼
A normal distribution with
a mean of zero, and
a standard deviation of one
ä¸è¬æ£å¤ªæ»ä½Nï¼ ï¼ ï¼å为æ åæ£å¤ªæ»ä½Nï¼ 0 ï¼1 ï¼
 Standard deviation illustration
 English: Nishiguchi. Boxplot and a probability den...
 English: Cumulative distribution function of the p...