1st trial Time(Seconds) The volume of oxygen produced (cmó) 5úC 15úC 35úC 45úC 55úC 75úC 30 4.5 18.0 28.0 26.0 12.0 0.0 60 6.0 26.0 33.0 31.0 14.0 0.0 90 6.5 29.0 34.5 32.0 15.0 0.0 120 7.0 30.0 35.0 32.5 15.5 0.0 150 8.0 31.0 35.5 33.0 16.0 0.0 180 9.0 32.0 36.0 34.0 16.0 0.0 2nd trial Time(Seconds) The volume of oxygen produced (cmó) 5úC 15úC 35úC 45úC 55úC 75úC 30 4.0 19.0 22.0 25.0 15.0 0.0 60 7.5 27.0 29.0 29.0 16.5 0.0 90 8.5 29.0 34.0 30.0 16.5 0.0 120 9.0 30.0 34.5 31.0 16.5 0.0 150 10.0 31.0 35.0 32.0 16.5 0.0 180 10.5 31.5 35.5 32.0 16.5 0.0 3rd trial Time(Seconds) The volume of oxygen produced (cmó) 5úC 15úC 35úC 45úC 55úC 75úC 30 2.5 20.0 24.0 26.0 13.0 0.0 60 4.5 27.0 28.5 32.0 16.0 0.0 90 6.0 29.5 30.0 33.0 16.5 0.0
 Temperature 12V
 D-558-2 launch from B-29 mothership
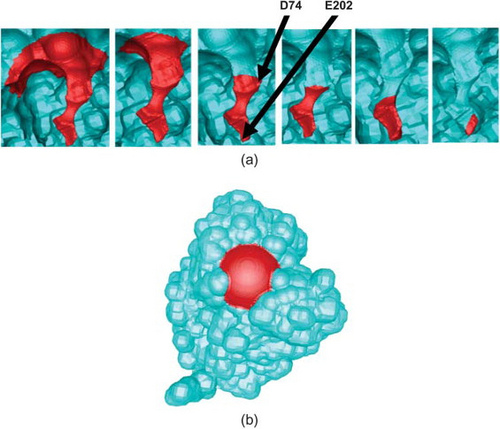 Continuum diffusion reaction rate calculations of ...
120 7.5 30.0 31.0 33.5 17.0 0.0 150 9.5 31.0 32.5 34.0 17.5 0.0 180 10.5 31.5 33.0 34.0 17.5 0.0 Figure 1 The volume of oxygen produced at different temperatures in a period 3 minutes Time(Seconds) The volume of oxygen produced (cmó) 5úC 15úC 35úC 45úC 55úC 75úC 30 4.25 19.00 23.00 25.67 13.33 0.0 60 6.75 26.67 28.75 30.67 15.50 0.0 90 7.50 29.17 32.00 31.67 16.00 0.0 120 8.00 30.00 32.75 32.33 16.33 0.0 150 9.00 31.00 33.75 33.00 16.67 0.0 180 9.75 31.67 34.25 33.33 16.67 0.0 Figure 2 The average oxygen produced at different temperatures in a period 3 minutes The data given in the tables shows the volume of oxygen produced by the reaction in a period of 3 minutes at different temperatures for each trial (Figure 1). The data in red shows anomalous results. The average data for the trials is also given...