1. Economic order quantities calculations:
In this case study, I use POQ to calculate Optimal Quantities to Order because some the parts are made by company's plastic-molding machines in an assembly operations and units can be assumed that are received incrementally during production. We also have the following assumptions:
- Only one item is involved because each type of toy has its own assembly line, only one toy can be assembled at a time on this line.
- Annual Demand is known
- Usage rate is constant
- Usage occurs continually but production occurs periodically
- The production rate is constant ( i.e. production rate of Toy Auto is 3500, Toy Truck, 1750; Toy Robot, 2333)
- There are no quantity discounts
Thus, we have to find out the Set up cost, Holding cost, Demand per year, Demand per week and production rate.
Therefore, we have
ÃÂ Set up Cost:
According to the case study, we have the shop labor rate is the sum of $6 per hour for wages, 33% fringe benefits and $6 per hour charged for overhead.
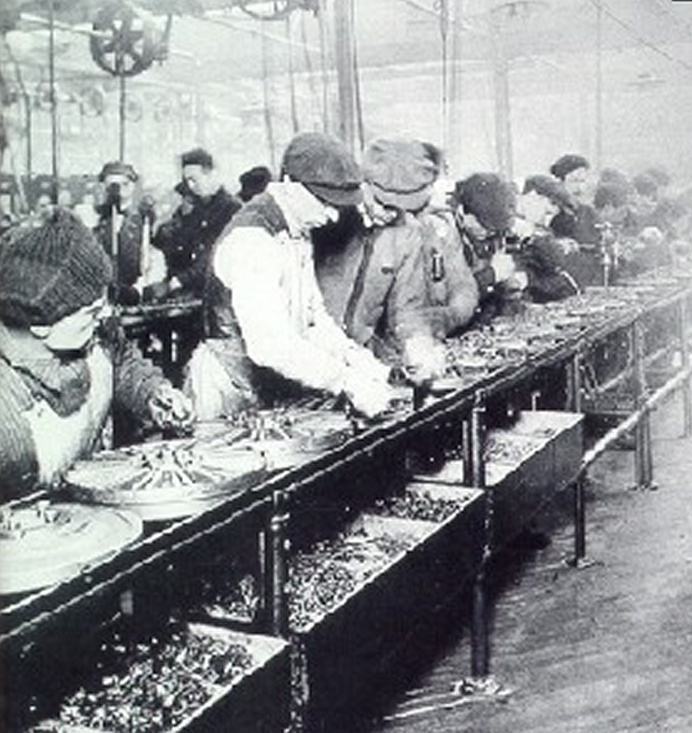 Ford assembly line, 1913.
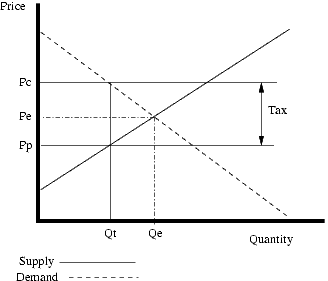 English: A diagram showing the effect of a per uni...
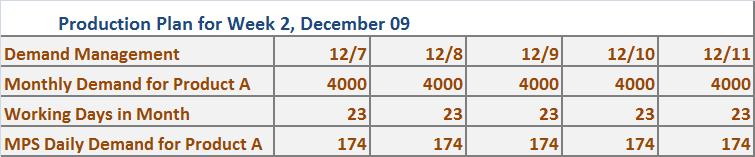 English: An example of a (very) simplified Master ...
Moreover, line 1 has 10 workers who engage in assembly. Thus, the setup cost is:
S = 1 hour * 10 workers * ( $6 wages + 0.33*6 benefits+ $6 overhead )
= $140
ÃÂ Holding Cost:
There is some ambiguity here. The subcomponent costs in Exhibit 4 do not always add up to the Cost Each (e.g. the cost for Auto is $3.9) which is level 0 item cost. So I assumed that Line 1 labor costs (at a fully burdened $6 + 0.33*6 + $6 = $ 14 per hour) were not included.
Hence, Item Cost per unit is the sum of Cost Each Item and the labor cost per item. You can see the results of Item...
Missing file
Missing excel document.
3 out of 4 people found this comment useful.