Research Simulation MemoMarch 9, 2009Attn: Mr. Howard Grey, CEOAquine, Mechanical Watch DivisionRe: Comprehensive Sales Research ReportDear Sir:The purpose of this report is to explain the decisions that were made in the third cycle of the simulation and explain why the recommendations of the stakeholders were not followed.
Information obtained during the September 1st scheduled meeting with Jean, Uma and Amanda included:â¢That the product is not advertised effectively.
â¢That the quality of the watches is the problem.
â¢Sales figures are going down, and the number of mechanical watched rejected by the SOCC had drastically increased.
The question to be answered was: what is the probability that the number of watches rejected by the SOCC might be the reason for the failing sales?For the first phase I was allotted $20,000 for data collection and one month to complete this phase. The breakdown for data collection for data for analysis and further investigation is as follows:Data for Analysisâ¢Perception about Chronometers $7,000â¢Response to Advertising $7,500â¢Mechanical Watch Industry Data $5,500Further Investigationâ¢Certification Proceduresâ¢Advertising StrategiesBy researching SOCC certification procedures, I learned that of the 37,500 watches Aquine sent for certification only 12,125 cleared the tests.
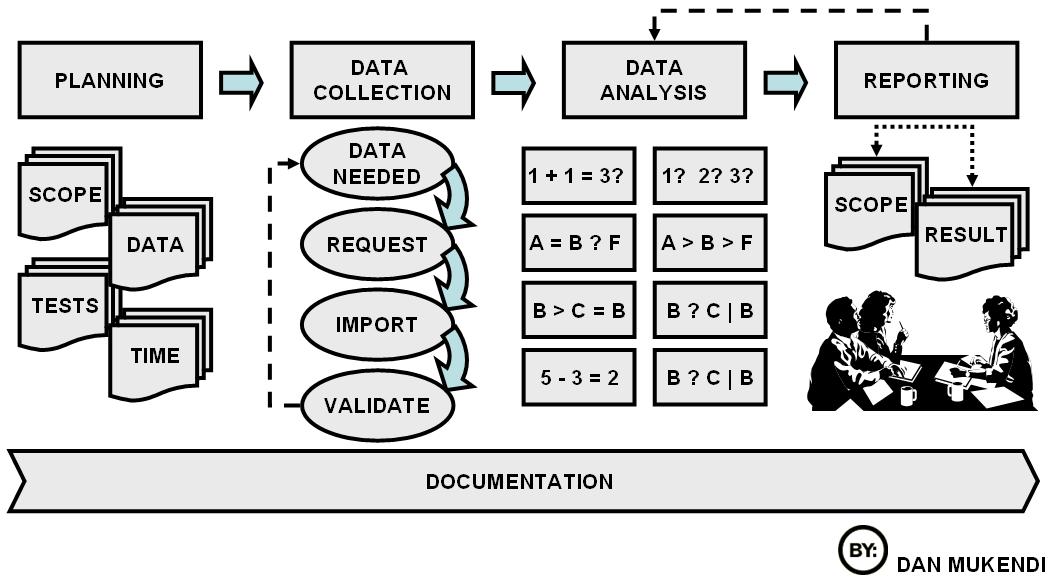 Data analysis
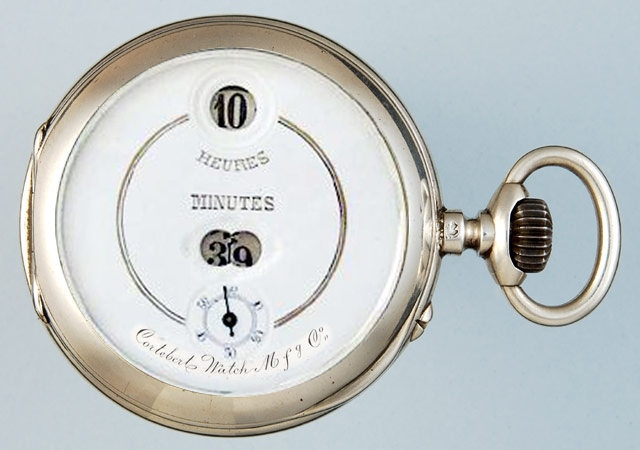 English: Cortébert Jump-hour from 1890s, Pallwebe...
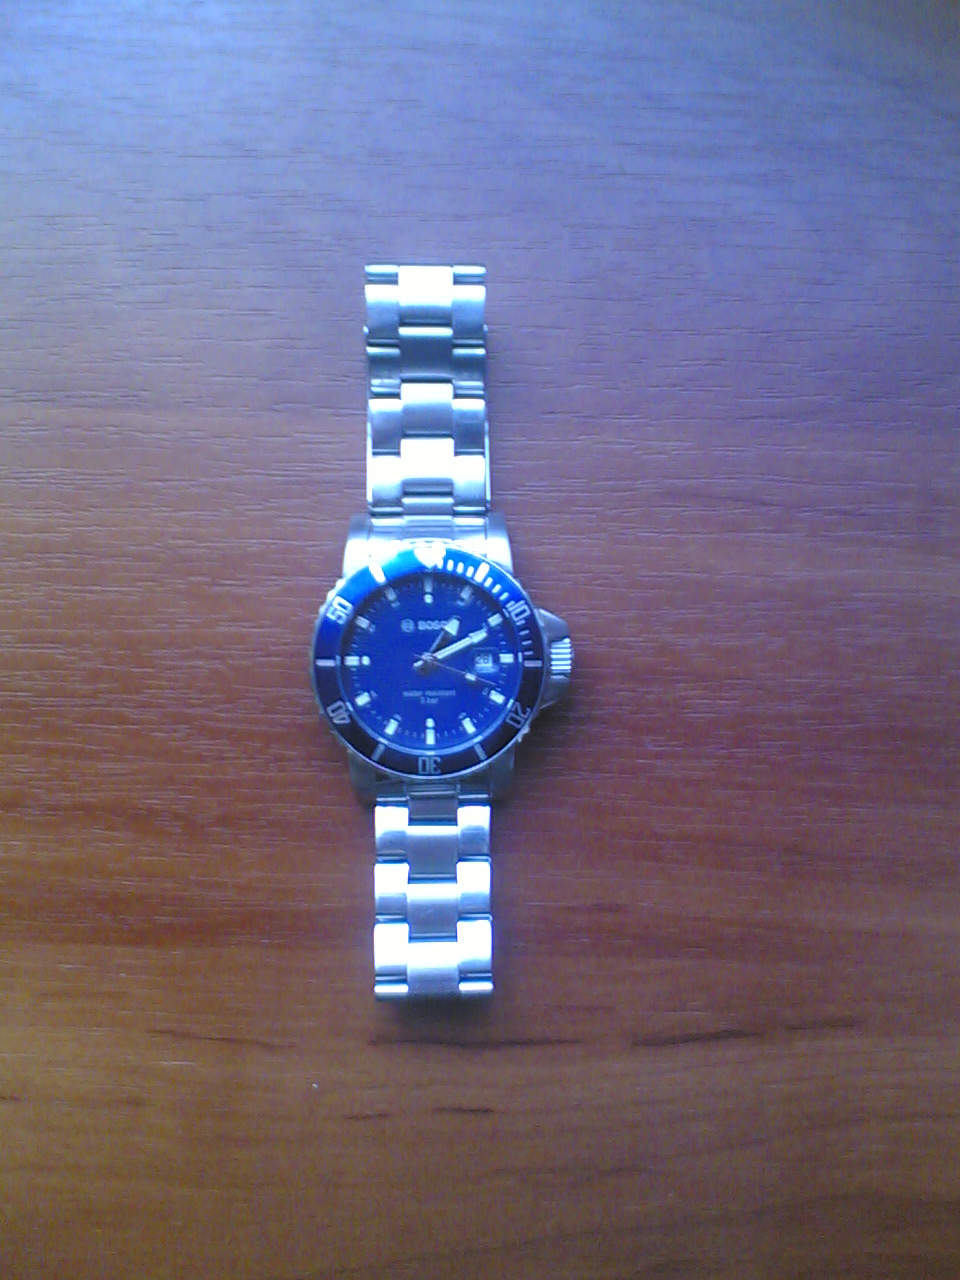 English: Bosch watches
The data for perception indicated that only 60% of respondents believed that SOCC certificates were important, which signified that only 78 percent 196 people were willing to pay more for watches with SOCC certificates. This was a clear indication that that the number of watches rejected by the SOCC is the reason for the failing sales.
For the second phase I was asked to experiment with different sample sizes, analyze the impact on rejection area, then select the tests that were responsible for the 67% rejection rate in the previous year. Sample size for data analysis included:â¢Variation of the Mean Daily Rateâ¢Rate Variation Due to Temperaturesâ¢Horizontal and Verticals in Rateâ¢Maximum Deviation in...
Confused
What am I reading? Is it notes? Is it part from a syllabus? Is it an e-mail to a professor? Or maybe a manager? And how exactly can this be of any help? I'm so confused!
0 out of 0 people found this comment useful.