SOUTHWEST AIRLINES
CASE STUDY
May, 2002 (note we want to consider whats going on now, Feb 2003)
Wow! An excited Colleen Barrett, new president of Southwest shouted in the meeting with her management team. We have bucked the money-losing trend that other U.S carriers are in and have reported a profit of $21.4 million in the first quarter of 2002. Now the management team is reflecting on second quarter 2002 results.
At the same time that Southwest Airlines reported this quarter, the nation's six largest airlines posted hefty losses. (We need to find latest financials)
Airline:1st Quarter 20021st Quarter 20011st Quarter 2000
American Airlines($43 million)$132 million
United Airlines($313 million)($99 million)
Delta Air Lines($133 million)$172 million
US Airways($178 million)($115 million)
Northwest Airlines($171 million)$3 million
America West($12.8 million)$14.6 million
Southwest Airlines' profit margin was 9.2% compared to industry 2.3%. We need to find out what it is now. What accounts for this enormous difference between SWA and the other carriers? What management policies and operating procedures does SWA follow that the other carriers do not? Ms.
 English: Herbert D. Kelleher (b. 1931), co-founder...
 English: Airline Ticket Receipt of Southwest Airli...
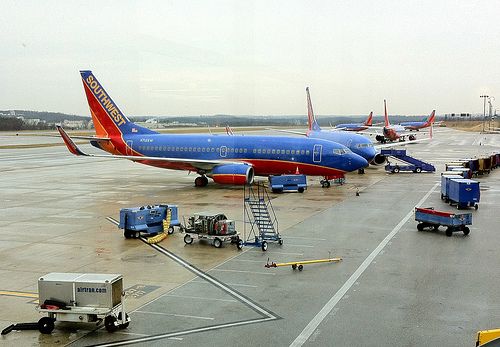 BWI Airport Southwest Airlines
Colleen Barrett is looking to the future. What's next with all this uncertainty in the airline industry? Ms. Barrett noted an article she was reading about another low-fare carrier JetBlue Airways entering the market. The new company is modeled after Southwest.
One thing that has helped SWA outperform its competitors is a hedging program it implemented to control rising fuel costs. In 2000, SWA hedged 80% of their fuel needs at a price based on crude oil at $22 per barrel. When the price of crude oil rose, and continued to rise, SWA was unaffected. As a result of their hedging, SWA paid an average of 78 cents per gallon compared to 82 cents per gallon paid by the competition.
Airline passenger traffic was...