IntroductionTo start analyzing the structure and the performance of the Irish trade, first of all we need to look at Irish GNP for the year compared with the previous years. 2007 was another positive year in the Irish economy. According to CSO, 2007 comparing with 2006, GNP value rise by 5.7% and GNP per capita rise by 3.3%. However, in 2006 compared with 2005, GNP value rises by 11% and GNP per capita rise by 8.3%. It indicates us a warning because the rate of increasing in GNP is falling that can lead to decrease in GNP by 2009 comparing with 2008. The reason is well known that Irish and International trade experiences economic downturn e.g. recession.
National Income (Current Market Prices) â¬mGross Product20042005200620071GDP - Value148,975162,168177,286190,603GNP - Value126,096137,265152,456161,210GNI - Value127,560139,072153,765162,121Source: CSONational Income (Current Market Prices) â¬Gross Product20042005200620071GDP - per capita36,82839,23041,81443,928GNP - per capita31,17233,20635,95837,154GNI - per capita31,53433,64336,26737,3641 PreliminarySource: CSOExternal Trade AnalysesTo get a better understanding of the Irish trade, we need to look at the countries imports and exports and relationship between them.
 Luck of the Irish
 Ireland's Highest Peak
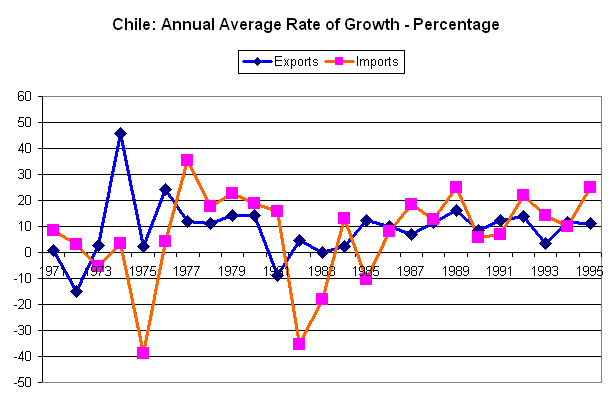 English: Chile: imports and exports, annual averag...
According to the graph and table given below, export decreased by 3.8 % in the first 6 months in 2008 comparing with the same time period in 2007. It shows us that economies in other countries were slowing down. However, the decrease by 4% in imports in 2008 resulted in almost no negative effect on overall economic growth.
Summary of Trade According to CSOData:SurplusImportsExports2006 Q1-Q212916.230150.143066.32006 Q3-Q412998.430707.343705.72007 Q1-Q214072.731405.845478.52007 Q3-Q411667.732079.943747.62008 Q1-Q213601.930149.643751.5More in detail, I wanted to show that items playing significant role for our current and capital accounts. I gathered information from CSO and represented it in my charts that shows different items and it` role in our accounts. The most positive players in our current and capital accounts is merchandise of course that brought 11.8 billion surplus for the...