Name
Student ID:
Course: EF 310, International Trade & Business
Lecturer:
Word Count:
Date: Friday, 14th November
Introduction
To start analyzing the structure and the performance of the Irish trade, first of all we need to look at Irish GNP for the year compared with the previous years. 2007 was another positive year in the Irish economy. According to CSO, 2007 comparing with 2006, GNP value rise by 5.7% and GNP per capita rise by 3.3%. However, in 2006 compared with 2005, GNP value rises by 11% and GNP per capita rise by 8.3%. It indicates us a warning because the rate of increasing in GNP is falling that can lead to decrease in GNP by 2009 comparing with 2008. The reason is well known that Irish and International trade experiences economic downturn e.g. recession.
National Income (Current Market Prices) â¬m
Gross Product | 2004 | 2005 | 2006 | 20071 |
GDP - Value | 148,975 | 162,168 | 177,286 | 190,603 |
GNP - Value | 126,096 | 137,265 | 152,456 | 161,210 |
GNI - Value | 127,560 | 139,072 | 153,765 | 162,121 |
Source: CSO |
National Income (Current Market Prices) â¬
Gross Product | 2004 | 2005 | 2006 | 20071 |
GDP - per capita | 36,828 | 39,230 | 41,814 | 43,928 |
GNP - per capita | 31,172 | 33,206 | 35,958 | 37,154 |
GNI - per capita | 31,534 | 33,643 | 36,267 | 37,364 |
1 Preliminary Source: CSO [2: http://www.cso.ie/statistics/nationalingp.htm] |
External Trade Analyses
To get a better understanding of the Irish trade, we need to look at the countries imports and exports and relationship between them.
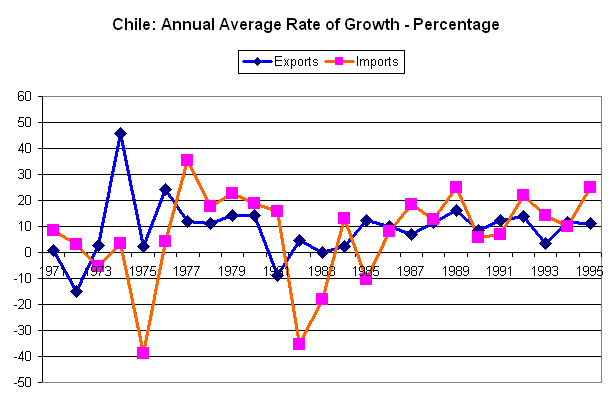 English: Chile: imports and exports, annual averag...
 European Union, showing member states and candidat...
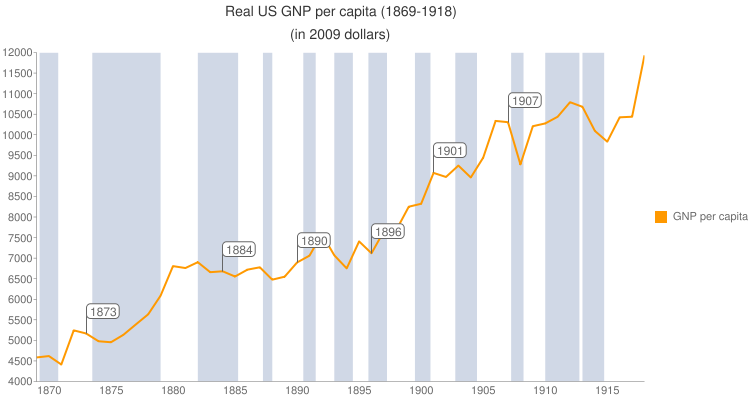 Real gross national product per capita of the Unit...
According to the graph and table given below, export decreased by 3.8 % in the first 6 months in 2008 comparing with the same time period in 2007. It shows us that economies in other countries were slowing down. However, the decrease by 4% in imports in 2008 resulted in almost no negative effect on overall economic growth.
Summary of Trade According to CSO
Data:
Surplus | Imports | Exports | |
2006 Q1-Q2 | 12916.2 | 30150.1 | 43066.3 |
2006 Q3-Q4 | 12998.4 | 30707.3 | 43705.7 |
2007 Q1-Q2 | 14072.7 | 31405.8 | 45478.5 |
2007 Q3-Q4 | 11667.7 | 32079.9 | 43747.6 |
2008 Q1-Q2 | 13601.9 | 30149.6 | 43751.5 |
More in detail, I wanted to show that items playing significant role for our current and capital accounts. I gathered information from CSO and represented it in my charts that shows different items and it` role in our accounts. The most positive players in our current and capital accounts is merchandise of course that brought 11.8 billion surplus for the Irish economy in the first half year in the 2008 and it`s accounted as 8.7 % of the total surplus in the current and capital accounts for the first two quarters. However, Irish merchandise exporters felt the full impact of the economic downturn in global markets and lost 5% of export value in the first half of year.
Surplus Items in the Current & Capital Accounts in the Q1 & Q2 for 2008
Deficit Items in the Current & Capital Accounts in the Q1 & Q2 for 2008
To talk mainly about export, I need to mention Services sector as it totalled 33.1 billion euro for the first six months, and it is up 4.9% on the same period of 2007. Services exporters also saw a reduction in demand but still remained in growth mood. To get a better understanding about the exports and imports analysis we need to look forward in the second half of the year. As cited in the www.irishexporters.ie
'The outlook for the second half of the year is heavily dependent on whether there will be a recovery in the value of the US dollar and UK pound starling versus the euro. But it is also very
dependent on the general economic conditions in our main trading markets. In this regard, a successful conclusion to the WTO Doha Round discussions in Geneva in July/August will give a strong impetus to world trade and with it greater demand for Irish exports of goods and services.
With these caveats the best case scenario forecast for the second half of the year is as follows;
⬠million | 2007 Actual Jun- Dec | 2008 Forecast Jun-Dec | Difference | % Change |
Merchandise | 43,265 | 40,000 | -3,265 | - 7.5% |
Services | 34.634 | 35.500 | +0.866 | + 2.5% |
TOTAL | 77,899 | 75,500 | -2.399 | - 3.1% |
For the year as a whole the IEA forecast is therefore;
>Total Merchandise exports for 2008 of 83,390 million.
>Total Services exports for 2008 of 68,576 million.
Giving an overall total export for 2008 forecast to be 152 billion euro. This is 1% below the 2007 figure for total exports, but 8 billion or 6 % up on the 2006 figures.'[3: http://www.irishexporters.ie/artman_new/uploads/iea_half_year_review_2008.pdf]
Irish economy is doing very well with the computer services. For the first half of the year it brought 11.5 billion surplus compared with the 10.4 billion surplus for the same period in 2007. And it seems to be rise further as exports in 2007 increased by 17.9% compared with 2006. The reason for that would be that many international companies like Dell, HP, Sony, Acer, Toshiba, and Samsung had been settled their businesses in Ireland and they exporting a lot of software to other different countries. And this value of surplus (exports minus imports) of additional software licenses is also included that largely affects total figure. Other important parts of services are royalties and licenses. Import for them was equals 9.5 billion in the first 2 quarters and it is 1.5 billion up compared with same period of 2007. Wanted to draw attention to the tourism and travel services. It shows us that our debit account for it is 3.2 billion for the first half of this year. However our credit amount is just 1.9 billion. All it tells us that Irish people more travels themselves and spends money abroad rather than international coming to Ireland for travel. Important for the Irish economy are insurance and financial services as well. However it slowed down compared with 2007 but it`s still largely up than in 2006.
To mention in more detail different products and countries where this products coming from or going to we need to look at the CSO publication on external trade. This publication clearly indicates main changes on the external trade in the first half of the current year. And it says:
'Exports decreased from â¬52,960m to â¬50,839m (-4%) -
_ Computer equipment decreased by 25%, Organic chemicals by 11%,
General industrial machinery by 13% and Metalliferous ores by 17%.
Chemical materials increased by 41%, Medical and pharmaceutical products
by 8%, Professional, scientific and controlling apparatus by 18% and
Petroleum products by 36%.
_ Goods to Switzerland decreased by 14%, the Netherlands by 16%, Germany
by 8%, the United States by 3% and the Philippines by 53%.
Goods to China increased by 31%, Malaysia by 70%, Spain by 5% and
Poland by 36%.
Imports decreased from â¬37,076m to â¬35,077m (-5%) -
_ Computer equipment decreased by 21%, Road vehicles by 14%, Special
purpose machinery by 14% and Electrical machinery by 14%.
Petroleum products increased by 24%, Natural gas by 35%, Fertilisers by
69% and Medical and pharmaceutical products by 9%.
_ Goods from Great Britain decreased by 3%, China by 14%, France by 16%,
Taiwan by 34%, Japan by 19% and Germany by 6%.
Goods from Denmark increased by 47%, the Netherlands by 8%, Poland by
50%, the United States by 1% and Finland by 40%.'[4: http://www.cso.ie/releasespublications/documents/external_trade/current/extrade.pdf]
I wanted to draw attention especially on petroleum products. Imports as well as exports highly increased in the first half of this year. The reason could be price. It significantly rose recently. And because of that exports and imports was affected and not because people started to use it much more.
As we mentioned countries already, we need to look at Ireland`s main trading partners which are Spain, Netherlands, Belgium, France, Italy, Germany, Switzerland, China, Japan, Great Britain and Northern Ireland and USA. It is nice to see that that Irish economy exports mainly brought to EU and it is totaled of 37.7% of all exports in the first half of the current year. Imports from EU totaled of 36.7%. It`s clearly shows that European market is working very well.
Main Trading Partners - 2007 â¬m
Imports | Exports | |
Great Britain and Northern Ireland | 20,516.6 | 16,594.1 |
Other EU Countries | 18,323.0 | 39,610.9 |
USA | 7,045.0 | 15,861.2 |
Rest of World | 16,924.3 | 16,785.9 |
Total | 62,809.0 | 88,852.2[5: http://www.cso.ie/statistics/botmaintrpartners.htm] |
Employment
In terms of employment, according to CSO in Ireland for the period from March until May were registered 115500 unemployed persons. And unemployment rate for this period was 5.2% which is greater than for the same period last year. In 2007 it was 4.6%. The reason would be global economic downturn. Because of that some percentage of unemployed prefer get social service and stay at home until the economic condition will improve. Of course there is a lot more reasons why people are not working.
Main employment economics sector are wholesale and retail trade. In this sector were employed 310700 people between March and May. Other important sectors are financial and other business services (296300 employed), different production industries (286400), as well as construction (25500) and health industries (223900). However, in some economic sectors employment is rising like in wholesale and retail trade compared with last year from March till May employment raised by 9.5%. In the sector of financial and business services employment rate rose by 9.6% and in agricultural, forestry and fishing this rate increased by 9.4%. One of Irish most stable economic sector is health. It rising from year to year more or less constantly
Economic Sector (NACE Rev.1) | Mar - May 01 | Mar - May 02 | Mar - May 03 | Mar - May 04 | Mar - May 05 | Mar - May 06 | Mar - May 07 | Mar - May 08 |
Health | 144.0 | 159.6 | 171.1 | 178.0 | 188.7 | 202.6 | 213.2 | 223.9[6: http://www.cso.ie/statistics/empandunempilo.htm] |
However, construction service has slowed down dramatically by 10.5% for the period from March till May this year compared with the same period last year. However, if we are going to compare different periods than changes are going to be more pessimistic. And it is expected to slow down further in the next year.
Index | |
Sep-06 | 113.8 |
Sep-07 | 110.1 |
Sep-08 | 89.6 |
'Employment in private firms (with five or more persons engaged) in the
Construction industry decreased by 18.6% in September 2008 by comparison with
September 2007. The monthly employment index decreased from 110.1 in
September 2007 to 89.6 in September 2008.'[7: http://www.cso.ie/releasespublications/documents/construction/current/indexemp.pdf]
International Investment Position
To analyze in detail Irish economic structure, we need to look at the Irish financial account. I will briefly show the investment position based on 2007 year. And to better understand the movement of investment we need to make a comparison with the previous years.
Data:
million | |
2004 | -26,908 |
2005 | -39,988 |
2006 | -9,452 |
2007 | -31,445[8: http://www.cso.ie/releasespublications/documents/economy/current/iip.pdf] |
At the end of the year, overall stocks of foreign assets totaled of 2.267bn, but liabilities amounted for 2.299bn. According to my graph, final net financial position or net liability amount equals to 21bn. And it is dramatically rose compared with the previous year. In 2006 it was just 9bn. To analyze financial account further then we can clearly see that:
'_ Portfolio Investment assets at â¬1,338bn were almost â¬108bn higher than at
end-2006. This was mostly due to increases in debt instruments. Liabilities
at â¬1,328bn increased by a similar amount, split roughly evenly between
equity and debt.
_ Overall Other Investment stocks of both assets and liabilities showed
substantial increases in 2007 with assets of â¬830bn being up â¬141bn on the
2006 level; liabilities of â¬839bn were â¬161bn higher. Net transactions in
assets during 2007 accounted for â¬161bn of the change in stocks but this
was offset by valuation and other changes of â¬20bn (mainly from exchange
ratemovements). Net transactions in liabilities amounted to almost â¬171bn
with valuation and other changes decreasing the stock level by almost
â¬10bn - see Table 4a and the box below.
_ Direct Investment Abroad continued its upward trend and at â¬99bn was up â¬7.4
billion on 2006. Direct Investment in Ireland reversed its downward trend and at
â¬131.4bn in 2007 was up â¬12.6bn on 2006. This was due to a combination of an
increase in equity stocks (including reinvested earnings) to â¬179.7bn and a
decrease in outflows of other capital to â¬48.3bn (mainly loans from IFSC
enterprises to their affiliates abroad' [9: http://www.cso.ie/releasespublications/documents/economy/current/iip.pdf]
I think I briefly introduced you with the key trends and performance of the Irish trade. And now we need to move on the world trade to see Irish position in that concept.
'Prospects for global growth have deteriorated over the past month, as financial sector deleveraging has continued and producer and consumer confidence have fallen. Accordingly, world output is projected to expand by 2.2 percent in 2009, down by some þ percentage point of GDP relative to the projections in the October WEO. In advanced economies, output is forecast to contract on a full-year basis in 2009, the first such fall in the post-war period. In emerging economies, growth is projected to slow appreciably but still reach 5 percent in 2009. However, these forecasts are based on current policies. Global action to support financial markets and provide further fiscal stimulus and monetary easing can help limit the decline in world growth.
Global activity is slowing quickly
World growth is projected to slow from 5 percent in 2007 to 3þ percent in 2008 and to just over 2 percent in 2009, with the downturn led by advanced economies (Table 1).
⢠Activity in the advanced economies is now expected to contract by ü percent on an annual basis in 2009, down þ percentage points from the October 2008 WEO projections. This would be the first annual contraction during the postwar period, although the downturn is broadly comparable in magnitude to those that occurred in 1975 and 1982 (Figures 1-2). A recovery is projected to begin late in 2009.'[10: http://www.imf.org/external/pubs/ft/weo/2008/update/03/index.htm]
In 2007 trade seems to be slowed down due to weakening demand in developed economies like Japan, USA, EU⦠It is weakened significantly because developed countries holds the biggest amount of shares in the world trade which means that developed countries mainly affects the world trade. Growth in world merchandise decreased by 6% in 2007. The reason could be a slowing down of import demand mainly in high developed countries like Japan, USA and Europe. However, trade remains strong in most developing countries like Africa, Middle East, developing Asia⦠Higher price tended to improve financial situation in certain countries. However those prices increased the inflationary pressure as well. Talking about the larger period of time then from the 2000 to 2007 exports increased on average by 2.7%. Exception will be 2001 when trade largely decreases due to dot.com bubble burst.
Talking about merchandise trade by product then we can clearly see that manufacturing products are the leaders in the industry, it is expanded by 7.5% in volume terms in 2007. Agriculture and fuels and mining products grew by 5% and 3% respectively. The slowing down in manufacturing products from the 10% level achieve is due to the trade slow down achieved partly due to decreased activity in major importing economies. However, Asian exports of manufacturing products, according to WTO, expanded by 13.5% in 2007.
To talk about value growth, then agriculture exports are leaders in this point. It expanded its exports by 19.5% and it is a highest growth since 2000. However, Europe holds a largest share totaled of 46% of world exports of agricultural products, increased products by 19%.Asia with the share of 19% increased exports by 20% which is record since 2000. Prices of fuels and mining products increased by 11% in 2007.
'
I
Trade flows within regions account for a higher share of world trade than flows between regions. Since 2000, this share has fluctuated from between 55 to 58 per cent. Relatively large differences have occurred in the growth of trade within regions: North America and Asia show a relative balanced growth between inter- and intra-regional trade; Europe's intra-trade is growing much faster than its external trade due to the deepening of its economic integration while South and Central America, Africa, the Middle East and the CIS have recorded higher growth in inter-regional exports than in intra-regional.'[12: http://www.wto.org/english/res_e/statis_e/its2008_e/its2008_e.pdf]
To mention emerging economies then Brazil, India and China shows tremendous growth in the world trade. However, Brazil and India is still just over 1% of the world trade. Brazil recorded positive trade balance of 34 billion dollar and its export grown at an annual average of 17%. Brazil mains partners are Europe which receive almost 27% of exports. India reached an annual growth of 19% since 2000. China holds 10% of world trade share, joined WTO In 2001 and quadrupled its exports while imports have more than tripled. In 2007 it reached tremendous trade surplus of 262 billion dollar.
To discuss commercial services then in 2007 it's increased at a faster rate of 18% than trade in goods of 15% for the first time in five years. While the services sector generates two-thirds of the total world value added, its share still remains small, such as 19%. The mayor exporters are European Union, the United States, Japan, China and India. In the last few years China and India`s exports of services have increased much faster than the world average.
If we are analyzing Ireland's trade we need to look at EU trade as well and see that position it facing comparing with other countries. I will briefly go through the most important points.
According to IMF, EU27 are second after USA for the trade deficit. For EU27 it was amounted of -185.1 billion euro and for the States for -624.1 bn. Euro. However, if this amount for USA felt in the first 3 months in 2008, then for EU27 in continuously rising.
EU27 is the main exporter to the world followed China and United States. EU27 exported 1241Bn Euro in 2007 and China and the USA 872bn and 829.3bn respectively. However, EU27 share is falling from 19.2% in 2003 to 17.4% in 2007. The one of reason could be that smaller and emerging economies showed constant growth in the past few years. Talking about EU27 exports in 2007 than 43.8% of it describes machinery and transport equipment, 25% goes for other manufacturing goods and 15.9% belongs to chemistry exports. USA have rather same shares ratio. Interesting fact that EU27`s almost quarter of its imports goes to energy or more precise 23.4%.
Ireland`s share in EU27 imports for 2007 equals as small as 2.6% and share of imports is 1.28%. However, Ireland is the second country which achieved a trade surplus in August 2008 amounted of 1.38bn Euro after Germany which did so with 4.39bn Euro surplus.
Conclusion
To conclude my assignment I wanted to cite `economist' journal. In my opinion it best describes the current and future situation in the Irish economy
'The extent of downside risk to the Irish economy is without precedent. Even the Economist Intelligence Unit's current forecast, of three successive years of negative economic growth, may prove optimistic.
We expect the Irish economy to suffer a sharp contraction in the 2008-10 period because of the collapse in the construction sector, depressed private consumption and weak export growth. Only from 2011 should the growth resume, but even this is subject to risk if the domestic property slump is deeper than we anticipate and the international financial crisis causes greater damage to the global economy than is our current global forecast.
The Irish banking system was saved from collapse in late September by government action, which increased liquidity and halted deposit depletions. However, the banks may well become insolvent, requiring nationalisation in one form or another in the early part of the forecast period.
From balance in 2007, the budget deficit is estimated to reach 5.8% of GDP in 2008 and just over 7% in 2009-10. Only from 2010 is the deficit expected to fall. These figures are subject to considerable uncertainty on both the revenue and expenditure sides.
Unemployment will rise sharply over the forecast period. The level it reaches will depend in part on the proportion of recent immigrants who choose to remain in the country and the level of emigration.
Following the rejection of the treaty of Lisbon by Irish voters in a referendum on June 12th, the country's position in the EU has been undermined. The most likely course of action for the government is to hold a second referendum on the treaty in 2009.
A"yes"vote would quickly restore Ireland's position and influence, whereas a"no"vote would generate a real crisis for the EU. Ireland would be sidelined in the bloc and could even face the other members moving to relegate it to a form of associate membership.
Despite the daunting challenges that it will face over the forecast period, we expect the coalition government to remain in office until the next scheduled election in 2012. '[14: http://www.economist.com/countries/Ireland/profile.cfm?folder=Profile%2DEconomic%20Data]