The Rio Tinto Minerals (RTM) facility in Boron California is experiencing a loss of revenue. In the past 18 months the RTM has sustained a shortfall of an estimated $1,754,000.After a complete analysis into the last 18 months of production issues, the problem became perceivable to be a unprocessed ore and premature equipment failure. Further investigation concluded the plant's (BAP) belt conveyor system accounted for the bulk of the equipment failure. Hence, resulting in approximately 15 % of loss bag tons per month in which 1 % can be directly related. The following will illustrate and analyze the central tendency and dispersion measures calculated using the data collected. We will formulate these calculations using the Gauss curve. The Gauss curve is one of the most common distribution function, especially in error theory. It can be traced back to 1733 in which the English-French mathematician de Moivre worked on the curve.
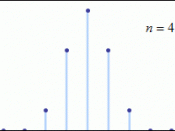
The Gaussian distribution can be proved that each measurement is the result of a large amount of small, independent error sources. The Gaussian distribution is also commonly called the "normal distribution" and is often described as a "bell-shaped curve". (Gauss curve, 2004)
Examining the data further, the three central tendency measures the mean, median, and mode can all be identified. The mean is the sum of all the lost tons recorded divided by the total number of the events. During the 18 month period, 29 events totaling 4,953 lost tons were identified. The calculated mean for the events is 151.2 lost tons per event. The median is determined by choosing the center in the progression of the events. If the total event number is odd, the middle value is the median. If the total event number is even, the two values in the middle are added...


