Geography 100 Second Term Project: Effects of El Nino in the Vancouver Region This report is an account of my findings over the previous year up to this year on the effects of El Nino on tides in Vancouver. To have an effective report, one must include data of a historical nature, especially when the subject is a phenomenon such as El Nino. The historical data is recorded from various sources such as the "Vancouver Tide Guide", "BC Fishing" and other such related sources. Since actual "hands on" examination of this global phenomenon is slightly impossible, I did the most that was possible. I recorded datum from various tide heights and cross-referenced these numbers to historical data.
1. High sea levels The 1997-98 El Niño increased sea levels along the entire coast of British Columbia and all through the Strait of Georgia. Sea levels at most ports in British Columbia, particularly Vancouver, were about 10 centimetres above normal in the summer of 1997, and were about 20 to 30 centimetres above normal in the winter of 1997-98.
 Jan Hooks
 BRITISH COLUMBIA 1955 plate
![Chart of abnormal ocean surface temperatures [ºC] observed in December 1997 during the last strong El Niño.](/uploads/11/113336/chart-abnormal-ocean-surface-temperatures-c-observed-decembe.gif) Chart of abnormal ocean surface temperatures [ºC]...
Chart of abnormal ocean surface temperatures [ºC]...In addition to El Niño, several other factors raise sea levels in winter. The winds along the West Coast generally increase sea levels by about 10 to 20 centimeters in winter. The gravitational pull of the moon and sun sets up highest tides in British Columbia in December and January.
The strongest sea level rise at Point Atkinson (in West Vancouver, see table below) attributed to any El Niño in our records was observed in 1982-83. On December 16, 1982, the observed high of 2.51 metres above mean sea level was the highest ever. This high water was 0.9 metres above the normal tide, of which almost 0.2 metres can be attributed to El Niño effects, and the remaining 0.7 metres is due to an intense storm. Two months later, on 27 January 1983, recorded levels at Point Atkinson rose to 2.40 metres, the fourth highest level recorded. During the 1997-98 El Niño, we did have high water events on 16 December 1997 and on 14 January 1998.
Extreme high waters at Point Atkinson (relative to mean sea level) Date (PST) Height (m) El Niño year? 16-Dec-82 2.51 yes 5-Dec-67 2.50 no 3-Jan-87 2.44 yes 27-Jan-83 2.40 yes 16-Dec-97 2.39 * yes 24-Dec-57 2.38 yes 24-Dec-68 2.38 no 15-Dec-77 2.38 yes 9-Feb-78 2.37 yes * Note -- The 16 December 1997 height is unofficial at this time.
2. Observed Sea Levels and El Niño Information ÷ Victoria, BC: 1997/98 Mean Sea Level Anomalies ÷ Bamfield, BC: 1997/98 Mean Sea Level Anomalies ÷ Tofino, BC: 1997/98 Mean Sea Level Anomalies ÷ Winter Harbour, BC: 1997/98 Mean Sea Level Anomalies ÷ Prince Rupert, BC: 1997/98 Mean Sea Level Anomalies ÷ 1997/98 Mean Sea Level Anomalies on the BC Coast ÷ IOS El Niño Watch Page ÷ IOS El Niño Information Page 3. Warm waters During strong El Niño events, such as 1957-58 and 1982-83, sea levels rise significantly and the coastal waters become much warmer. The warm waters arrive in British Columbia from the south, and can be carried to our shores as a northward traveling pulse of coastal water that begins its journey off Peru, and flows all along the coast of South and North America. During most El Niño years this pulse reaches southern California, and during strong events this warm water reaches British Columbia.
Warm waters are also brought to our shores by stronger winds in El Niño winters. During a typical El Niño, the Aleutian low pressure system that develops every winter becomes even stronger, and increases the strength of winter winds from the south. These winds carry warmer water northward along the British Columbia coast.
In the past, warm El Niño waters have altered the migration routes of Fraser River sockeye salmon on their return from the Gulf of Alaska. In most summers following an El Niño winter these sockeye swim northward around Vancouver Island, rather than southward through Juan de Fuca Strait. In 1997, El Niño arrived earlier in the year, and Fraser River sockeye chose the northern migration route during El Niño, rather than in the following summer.
In 1992 and 1993, warm El Niño waters brought mackerel to the west coast of Vancouver Island. These fish devoured juvenile salmon, and ate into the salmon stocks of the west coast of the island.
In 1958, following the 1957-58 El Niño, warm waters allowed the Japanese oyster to spread all through the Strait of Georgia.
4. The 16 December 1997 Event The unofficial maximum height at Point Atkinson at 0744 Pacific Standard Time 16 December 1997 was 5.48 metres above chart datum, which is 2.39 metres above mean sea level, and 13 centimetres below the record high. Unofficially, this is the fifth highest ever recorded. The record high was set on 16 December 1982, exactly 15 years ago, and was also during an El Nino winter.
The predicted high on 16 Dec 1997 was 4.8 metres above chart datum, so the extreme was 68 centimetres above predictions. In 1982 the extreme was 90 centimetres above predictions. Records at Point Atkinson go back to 1914.
The table below includes the unofficial results for two other sites.
Extreme high waters for 16 Dec. 1997 (relative to mean sea level) Location Obs. Height (m) Pred. Height (m) Height Diff. (m) Victoria 1.30 0.82 0.48 Patricia Bay 1.93 1.31 0.62 Pt. Atkinson 2.39 1.71 0.68 5. The 14 January 1998 Event The unofficial maximum height at Point Atkinson at 0709 Pacific Standard Time 14 January 1998 was 5.38 metres above chart datum, which is 2.29 metres above mean sea level, and 23 centimetres below the record high. The record high was set on 16 December 1982, about 15 years ago, and was also during an El Nino winter.
The predicted high on 14 Jan. 1998 was 4.7 metres above chart datum, so the extreme was 68 centimetres above predictions. In 1982 the extreme was 90 centimetres above predictions. Records at Point Atkinson go back to 1914.
The table below includes the unofficial results for two other sites.
Extreme high waters for 14 Jan. 1998 (relative to mean sea level) Location Obs. Height (m) Pred. Height (m) Height Diff. (m) Victoria 1.19 0.72 0.47 Patricia Bay 1.79 1.14 0.65 Pt. Atkinson 2.29 1.61 0.68 6. Record High Mean Sea Levels The following table gives the preliminary January 1998 Mean Sea Level values for the British Columbia coast. The one-month average sea levels at the following six ports were the highest ever recorded for any January: Victoria, Vancouver, Bamfield, Campbell River, Winter Harbour and Bella Bella. In addition, the one-month average sea levels at the following four ports were the highest ever recorded for any month: Victoria, Vancouver, Winter Harbour and Bella Bella.
Mean Sea Levels for January 1998 (Unofficial, relative to Chart Datum) Location (Identifier) Jan. MSL (m) Previous Jan. High (m) Highest Jan. ever? Previous Monthly High (m) Highest month ever? Victoria (7120) 2.270 2.252 (Jan 1914) Yes 2.262 (Feb 1983) Yes Vancouver (7735) 3.441 3.405 (Jan 1914) Yes 3.405 (Jan 1914) Yes Bamfield (8545) 2.420 2.405 (Jan 1983) Yes 2.424 (Feb 1983) No Campbell River (8074) 3.241 3.235 (Jan 1983) Yes 3.272 (Feb 1983) No Port Hardy (8408) 3.286 3.292 (Jan 1983) No 3.292 (Jan 1983) No Tofino (8615) 2.514 2.716 (Jan 1914) No 2.716 (Jan 1914) No Winter Harbour (8735) 2.646 2.530 (Jan 1995) Yes 2.530 (Jan 1995) Yes Bella Bella (8976) 3.255 3.198 (Jan 1983) Yes 3.229 (Feb 1983) Yes Prince Rupert (9354) 4.222 4.246 (Jan 1914) No 4.246 (Jan 1914) No Log Weather Geography 101 97.10.21 First day. Not much happening. Just some Clouds, quite bright I must say. Well, its about 10:30 and it still is pretty sunny. Some cloud covering starting, kinda thin clouds. It is getting warmer by a little bit. There is a slight wind but too little, maybe a breeze. Its noon now, and its still chilly but bright outside, the clouds have moved on, nothing exciting. Around 3:00, the wind is picking up very minuscule. Total coverage of the sky by clouds, very overcast.
97.10.22 So tired, too early in the morning to be doing this. It is quite warm for morning temperature. There is little to know wind, however the sky is covered with clouds. I think they are Nimbus clouds, look like it is ready to rain, nimbo stratus maybe. Or maybe cirus-Stratus. Today is warmer than yesterday. The whole day was cloud-coveredâ¦d'oh 97.10.23 Today is also warmer. Cloud covering is really different. Right now there is little cloud covering. But then I can see clouds coming from different direction. Alto stratus cloud. Clouds are moving although you can't feel wind down here. Right now is noon, and I see no clouds, its is warm. About 3:00, and nothing exciting, same old but about half the sky is covered.
97.10.24 Wahoo, last day to wake up early to look at the sky. Oohhh, really cold. Sky is totally covered, clouds are pretty high though, mid-range maybe. Somewhat dark. Now is about 10:20 and sky is cover in about three quarters by clouds. The wind is colder and I can feel it blowing. 12:25, total sky is covered with dark clouds, nimbus clouds. But warmer. 2:40, same as noon.
N.B. re-written from log which got wet and ink bled. Had to remember what happened, but still could read and try to extrapolate what happened those days.
 El Niño (text in portuguese)
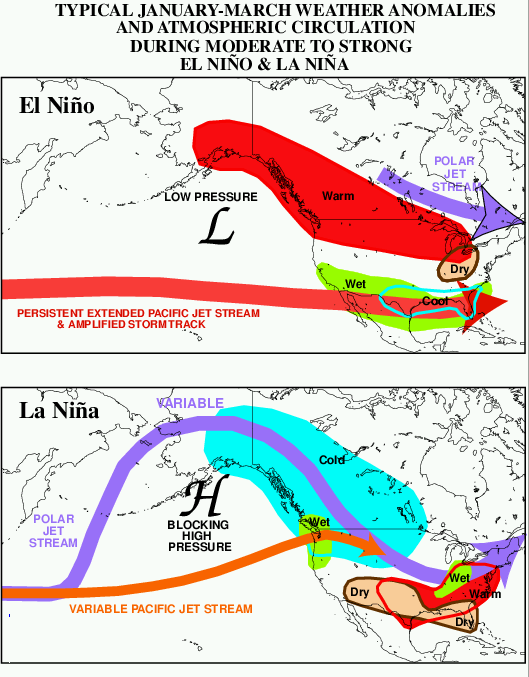 El Niño effects upon North American weather and a...
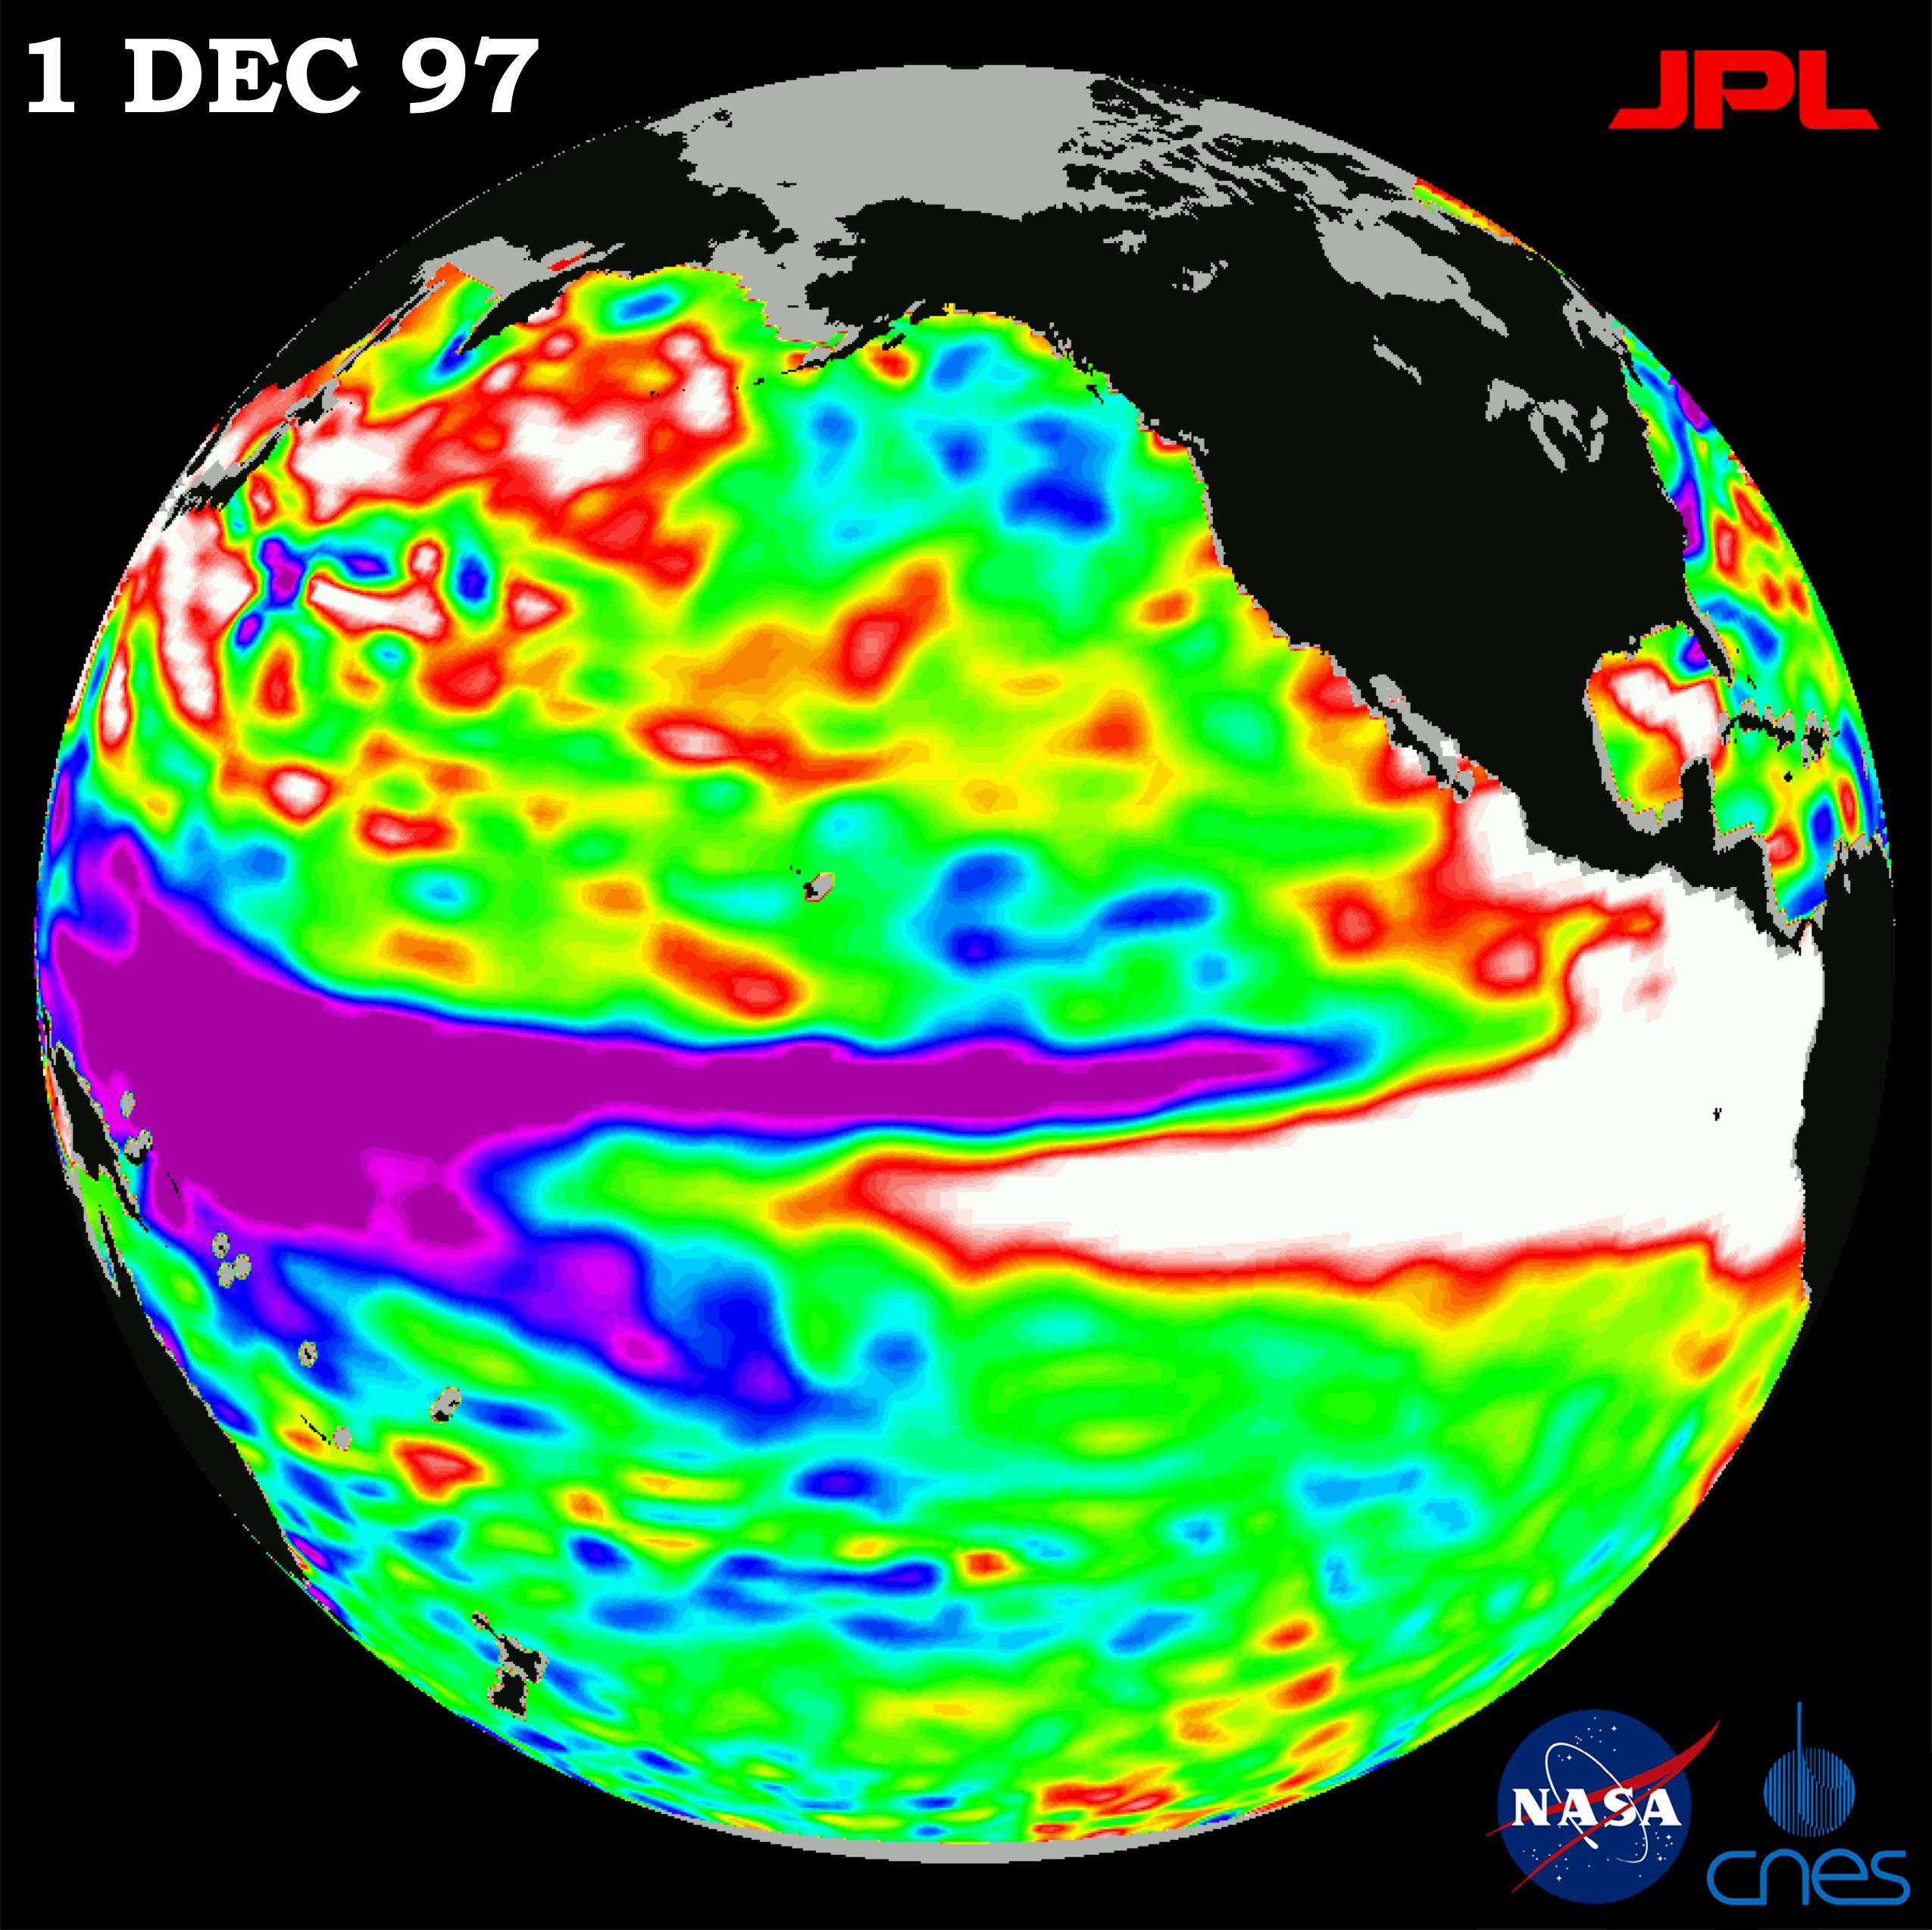 OSTM/Jason-2's predecessor TOPEX/Poseidon caught t...