Major League Baseball is one many sports that is loved by many individuals. Each team tries to recruit the best players with attractable wage packages which in turn lead to an uneven balance of wages on any team. This is where descriptive statistics come into play since descriptive statistics is a summary of all the data that is collected. One can organize the data numerically or graphically. The paper will focus on the players' salaries by coasts.
BinFrequency601701803903More3BinFrequency600701802905More2BinFrequency600702804902More1BinFrequency15000001250000073500000245000001More0BinFrequency15000001250000023500000645000001More0BinFrequency15000000250000033500000545000001More0BinFrequency2000000004000000037000000049000000031200000001140000000017000000001900000000More0BinFrequency2000000004000000017000000039000000021200000002140000000117000000001900000000More1BinFrequency2000000004000000007000000059000000021200000002140000000017000000001900000000More0Measuring Attendance, Salary and Games WonThe charts included in this paper are frequency distribution and histogram chart. These charts provide visual supporting documentation of the hypothesis; that East Coast team's salaries are higher than West Coast and Central Area teams, and that West Coast and Central Area team's average as many or more wins as East Coast teams. There are numerous factors not referenced in the charts below, however; support the reason why East Coast team's salaries are higher than West Coast and Central Area teams, such as: more sales in advertisements, recruit players based on name recognition - award larger contracts, larger stadiums, and style of baseball.
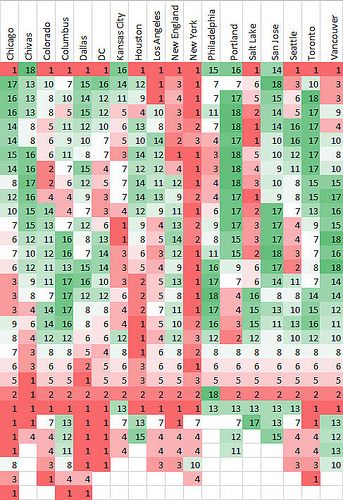 2011 MLS Salary Grid
 Salary Proposal
 English: Baseball uniform(s) in the 1870's
Other reasons supporting the fact that West Coast and Central Area teams average as many or more wins as East Coast team, which is also not referenced in the charts below, include: recruiting begins in high school, players are trained through the minor league system, and the style of baseball - players run section-by-section plays vs. home runs.
The charts displayed in this paper measure the attendance and salary ranges of the West, Central and East Coast team's through frequency distribution, defined as: "the number of times various subcategories of a phenomenon occur, from which the percentage and cumulative percentage of any occurrence can be calculated," (Sekaran, 2003, page 23 - 24). According to the...