Determination of Zinc and Nickel Concentration by (1) Ion-Exchange Chromatography Followed by Chelometric Titration, and by (2) Atomic Absorption Spectroscopy of the Mixture
Experiment 4
Dates of Experiment: 10/14/08 through 10/30/08
Date of Report: 11/7/08
Chem 2262L
�
I. Introduction
In this experiment, the zinc and nickel contents of unknowns were tested using two methods. In the first method, nickel and zinc were separated through ion-exchange chromatography and analyzed through chelometric titration. In the second method, the unknown was analyzed through the atomic absorption spectroscopy (AAS) of the mixture.
In and ion-exchange column, the ions are separated due to their tendencies to interact with the fixed phase of the column. In this case, the anion-exchange resin is that fixed phase. Nickel passed through the column unhindered and therefore first. Zinc formed chlorozincate anions that reacted with the resin. It could not pass through the column until a neutral aqueous solution was run through.
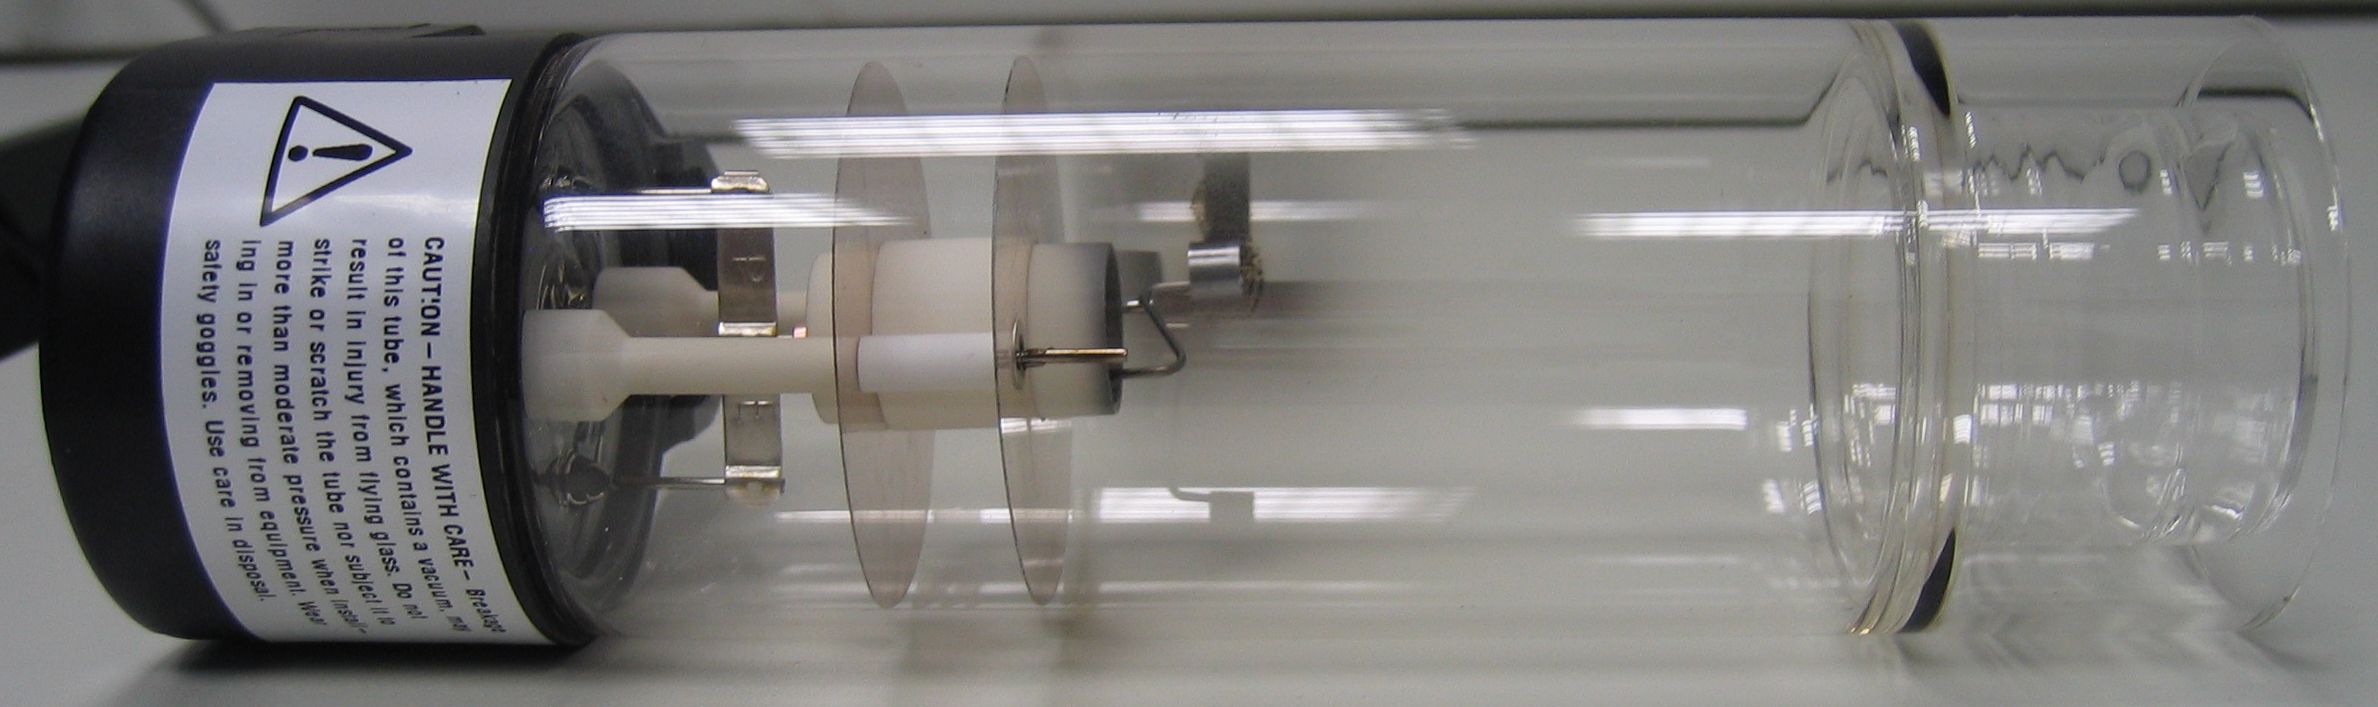 Deutsch: Das Bild zeigt eine Mehrelement-Hohlkatho...
 Aas Landbrugsskole
 Aas Jernbanestation, 1922
The elements were determined quantitatively by titration with ethylenediaminetetraacetic acid (EDTA). This method is valued as a good estimate and is used widely because of its use of common lab equipment. Only a single column was run for each metal in the interest of time. To acquire a meaning for the effect that the method has on the outcome, one should split the sample into replicates before the column. However, this may lower the accuracy, reduce the precision, and increase the time of the analysis.
In AAS, ions are distinguished due to the wavelength of light emitted when atomized ions are passed through a flame. Each element has a characteristic wavelength of light emitted. The instrument is calibrated using standard solutions prior to passing samples through. The results are interpreted using a calibration curve. This method is valued due to its efficient speed, ease of use, high selectivity, accuracy, and precision. A disadvantage is that it requires a special piece of machinery to do the experiment.
II. Procedure
In order to prepare the ion-exchange column, glass wool was placed above the stopcock of a buret. Thirty to 40 milliliters (mL) of anion-exchange resin were added to the buret. A wash of 100 mL of two molar HCl was passed through the column. The sample was prepared by adding 16 mL of concentrated HCl to 75 mL of unknown solution and diluting that to 100 mL. The 30 mL sample was transferred to the top of the column. Four hundred mL of two molar HCl were washed through the column after the sample at a rate of 5 mL a minute. All of the wash was collected in a 500 mL beaker. The beaker was replaced with another 500 mL beaker in order to catch the next wash of 450 mL of deionized water.
The first beaker contained the nickel sample. It was divided into three aliquots, and the liquid was evaporated. Each residue was dissolved in 100 mL of distilled water and mixed together. Approximately 10 mL of pH 10 buffer were added. The entire solution was diluted to 500 mL. Half a gram of murexide indicator was added to the dilution. Three 50 mL aliquots were titrated with standardized EDTA until the color changed from purple to yellow. All data was recorded in Table 1.
The second beaker contained the zinc sample. It was divided into three aliquots, and approximately five mL of pH 10 buffer were added to each beaker. Two drops of Eriochrome Black T indicator were added to each sample. Each was titrated against standardized EDTA until the color changed from red to blue. All data was recorded in Table 2.
For AAS, two large samples were prepared. For nickel analysis, 33 mL of unknown solution were diluted to 50 mL. For zinc analysis, 2 mL of unknown solution were diluted to 50mL. Three standard solutions of 20, 40, and 60 parts per million (ppm) of nickel were run through the AAS instrument. All absorbencies were recorded in Table 3. A calibration curve was made from that data (Figure 1). The solution for nickel analysis was run through the instrument for three tests. All absorbencies were recorded in Table 4. Three standard solutions of 1.2, 2.4, and 3.6 ppm of zinc were run through the AAS machine. All absorbencies were recorded in Table 5. A calibration curve for zinc was made from that data (Figure 2). The zinc analysis solution was run through the AAS for three tests. All absorbencies were recorded in Table 6.
III. Data
Table 1: Titration of Nickel in 0.0100 M EDTA
Initial mL | Final mL | Total mL |
0.00 | 1.125 | 1.125 |
1.50 | 2.60 | 1.10 |
2.60 | 3.70 | 1.10 |
Table 2: Titration of Zinc in 0.100 M EDTA
Initial mL | Final mL | Total mL |
0.00 | 3.00 | 3.00 |
3.50 | 6.50 | 3.00 |
8.20 | 11.70 | 3.50 |
Table 3: Standard Solutions of Nickel
Concentration (ppm) | Absorbance |
20 | 0.166 |
40 | 0.280 |
60 | 0.418 |
Table 4: Unknown Absorbencies of Ni
Sample | Absorbance |
1 | 0.169 |
2 | 0.167 |
3 | 0.166 |
Table 5: Standard Solutions of Zinc
Concentration (ppm) | Absorbance |
1.2 | 0.352 |
2.4 | 0.420 |
3.6 | 0.442 |
Table 6: Unknown Absorbencies of Zn
Sample | Absorbance |
1 | 0.380 |
2 | 0.386 |
3 | 0.384 |
Figure 1
Figure 2
IV. Calculations
Concentration of Nickel as Determined by EDTA Titration
Example Calculations for Titration 1
Titration 2: 0.00489 M
Titration 3: 0.00489 M
Concentration of Zinc as Determined by EDTA Titration
Example Calculations for Titration 1
Titration 2: 0.040 M
Titration 3: 0.047 M
Concentration of Nickel as Determined by AAS
Example Calculations for Sample 1
Sample 2: 0.00068 M
Sample 3: 0.00067 M
Concentration of Zinc as Determined by AAS
Example Calculations for Sample 1
Sample 2: 0.00393 M
Sample 3: 0.00392 M
Mean Concentrations
Example Calculations for Ni as Determined by AAS
Zn Determined by AAS: 0.00391 M
Ni Determined by EDTA Titration: 0.00511 M
Zn Determined by EDTA Titration: 0.0423 M
Standard Deviation
Example Calculations for Ni as Determined by AAS
Zn Determined by AAS: 0.000026
Ni Determined by EDTA Titration: 0.00038
Zn Determined by EDTA Titration: 0.004
Both Ni Methods: 0.003
Both Zn Methods: 0.038
RSD
Example Calculations for Ni as Determined by AAS
Zn Determined by AAS: 0.0066
Ni Determined by EDTA Titration: 0.075
Zn Determined by EDTA Titration: 0.0946
Percent Error
Example Calculations for Ni as Determined by AAS
Zn Determined by AAS: 223%
Ni Determined by EDTA Titration: 69.6%
Zn Determined by EDTA Titration: 231%
V. Error Analysis
In this experiment, several sources of random and systematic error presented themselves. Most of the error was encountered in the anion-exchange column and EDTA titration phase of the experiment. This was due to several uncertainties in the construction of the experiment. The ability of the resin to hold chlorozincate ions is unknown. It seems as though the resin could not contain these ions because the concentration of nickel obtained from the experiment was too high. The presence of zinc in a nickel titration raises the equivalence point and gives a higher than actual concentration of nickel. Also in the EDTA titration, the murexide indicator never obtained the correct starting color. Perhaps the equivalence point was reached earlier, but the color change was impossible to note with a purple color already present. Other sources of error throughout the experiment resulted from a lack of proper equipment (i.e. pipettes for dilution measurements).
VI. Conclusion
Despite the lack of accuracy in the experiment, both methods presented were very precise. The expected concentration of nickel in the unknown was 0.00125 M. The concentration was determined to be 0.00068 M and 0.00153 M through EDTA titration and AAS respectively. The percent errors for the values were 45.6% and 69.6% correspondingly. The expected concentration of zinc in the unknown was 0.00121 M. The concentration of zinc was determined to be 0.00391 M and 0.0423 M through EDTA titration and AAS respectively. The percent errors for the values were 223% and 231% in that order. The extremely high error indicates either poor techniques or a contaminated unknown. Due to the reproducibility (high precision) of the results, one may assume that it was indeed a contaminated sample.
VII. Works Cited
"EDTA Titrations" (Chapter 12, pp. 228-249), Harris Quantitative Analytical Chemistry, 7th edition, 2007
"Atomic Spectroscopy" (Chapter 21, pp. 453-473), Harris Quantitative Analytical Chemistry, 7th edition, 2007
_1286877283.unknown
_1287518955.unknown
_1287566893.unknown
_1287570164.unknown
_1287570190.unknown
_1287566938.unknown
_1287567158.unknown
_1287519059.unknown
_1287433694.unknown
_1287433724.unknown
_1287434253.unknown
_1287434666.unknown
_1287433788.unknown
_1287433705.unknown
_1287433609.unknown
_1287433630.unknown
_1286877335.unknown
_1286877075.unknown
_1286877150.unknown
_1286877256.unknown
_1286877125.unknown
_1286876634.unknown
_1286876822.unknown
_1286876311.unknown
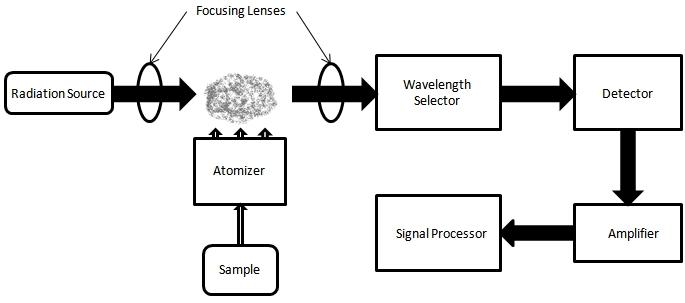 English: AAS Block Diagram
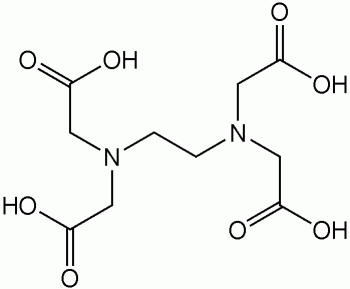 Skeletal formula of ethylenediaminetetraacetic aci...
 English: Atomic Absorption Spectrometer Deutsch: A...