Aim
This experiment aims to determine the effect an increasing temperature has on a typical plant cell structure.
Introduction
Cells are surrounded by thin membranes (approximately 5 nm) that separate inside from out, life from non-life. These cell membranes perform many functions:
÷Barrier: membranes keep the contents of the cell together, allowing nutrients to pass in but keeping out many harmful substances.
÷Signalling: membranes relays information about the surroundings of the cell tot eh inside and in the other direction
÷Factory site: membranes provides places where enzymes can be arranged in an assembly line fashion
÷Energy conversion: membranes allow light and chemical energy to be converted into more usable forms
÷Subdividing the cell: in most cells, membranes separate different parts of the cell which perform different functions
÷Recognition: different cell membranes have different surfaces and will interact differently with other cells. This allows cells to recognise one another and act accordingly; human cells cooperate wit each other while they may attack foreign cells including harmful bacteria
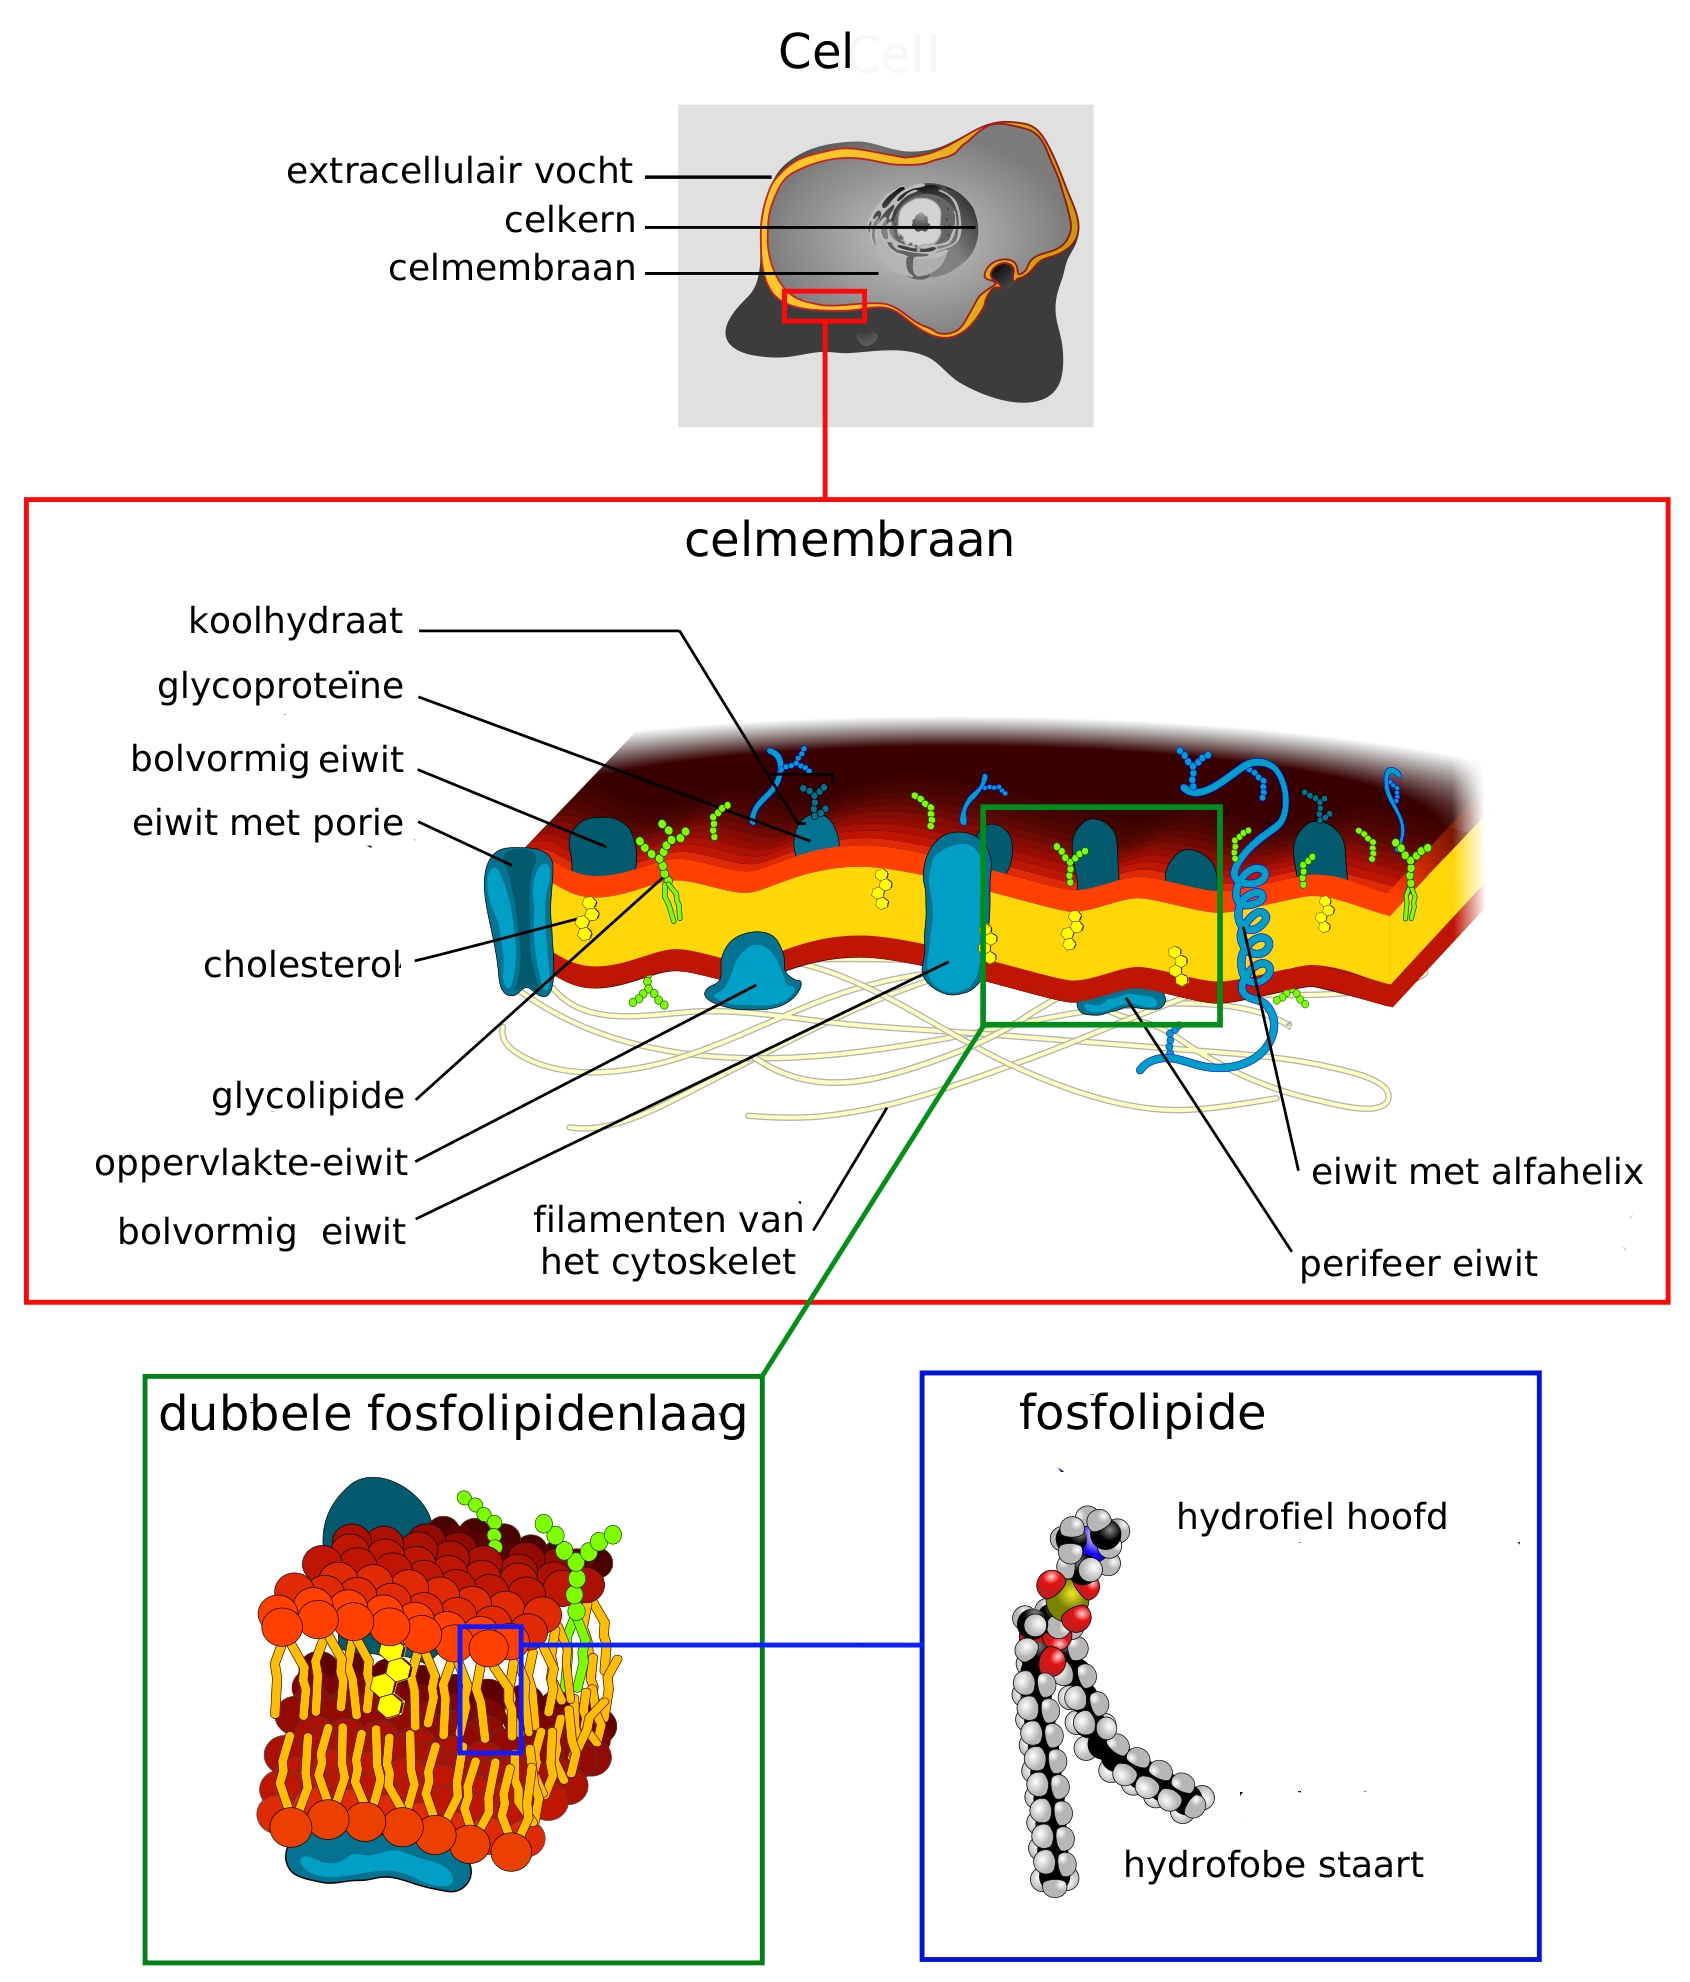
Structure of the cell membrane
In 1972 the fluid mosaic model was discovered and is now accepted as the basis of our understanding of cell membranes: It is understood as an asymmetrical mosaic of lipids and proteins.
 The cell membrane, also called the plasma membrane...
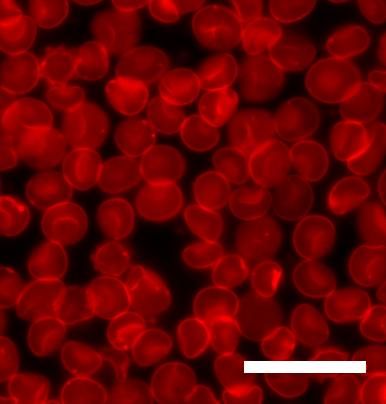 English: Human red blood cells (erythrocytes) supp...
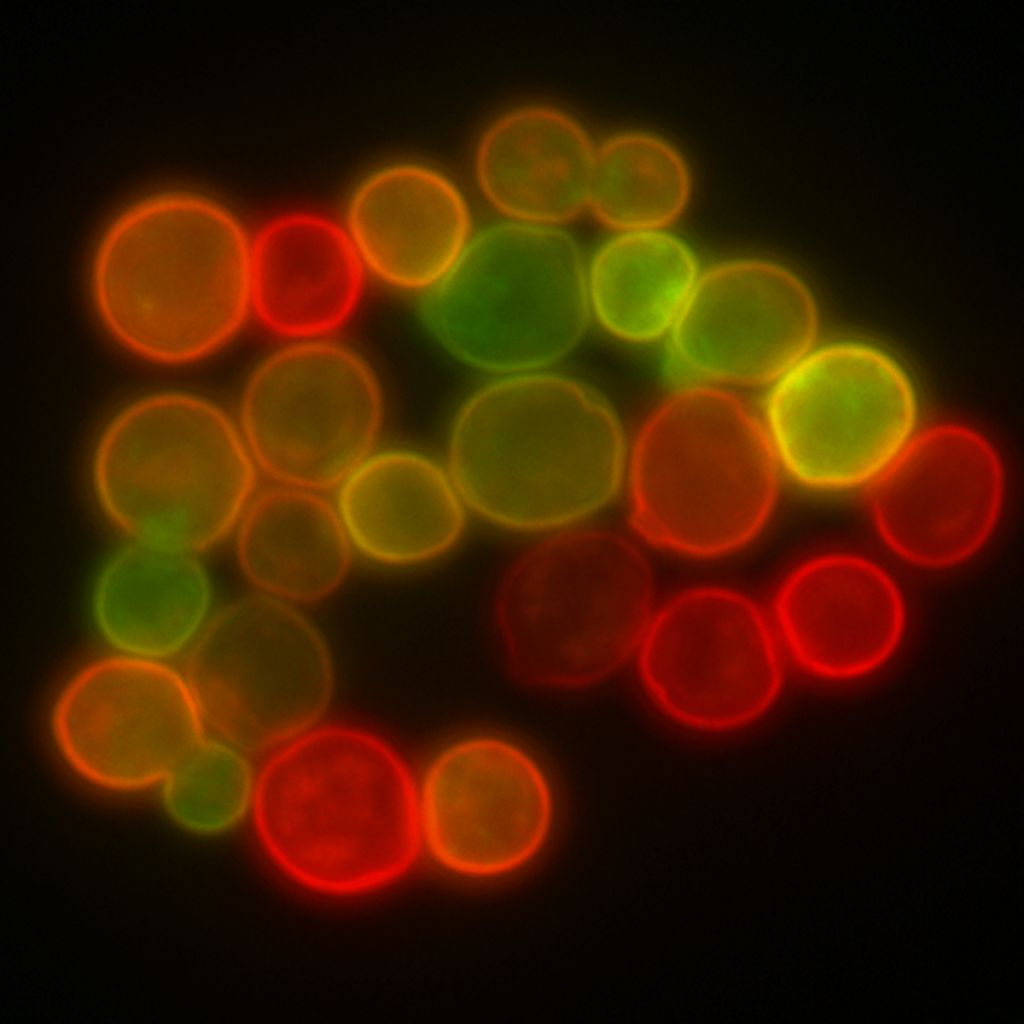 English: Yeast cell membrane visualized by some me...
The membrane shows fluid behaviour because of movements and packing variations among its lipids and proteins.
The lipid bilayer is two layers of lipid molecules sandwiched together. The lipid molecules have two ends: one is hydrophilic (water loving) and the other is hydrophobic (water hating). When lipid molecules are placed in aqueous solutions they spontaneously form a bilayer structure with the hydrophilic heads on the outside (in contact with the solution) and the hydrophobic tails away from the solution. This is shown in the diagram below:
Cell membranes are also made up of the following:
vCholesterol - Has hydrophilic head, hydrophobic tail and fits neatly between phospholipids molecules.
-Helps to regulate fluidity of membrane
-Important in mechanical stability
-Reduces uncontrolled leakage
vGlycolipids - Form when carbohydrate attaches to lipid
-Act as receptors for chemicals
-Used as signals between cells
vGlycoproteins - Form when carbohydrates combine with membrane proteins
-Also act as receptors and make connections with other cells
vProteins - 1000's of different proteins may be found. E.g. Enzymes for digestion, receptor molecules for hormones - Receptor stimulates other membrane proteins, carrier and channel proteins allow passage of water soluble ions, sugars, amino acids, proteins.
The current best model of what a cell membrane looks like is in the figure below. As you can see it is made up of two parts. They are the phospholipids (magenta and green), the proteins (orange and red), and the carbohydrates (black). Carbohydrates can be attached to either the phospholipids or the proteins in the cell membrane.
Diagram from http://www.usd.edu/~bgoodman/Membrane.htm
Proteins are made up of specific amino acids and only work in certain conditions, for example, the pH has to stay constant, as does the temperature. If these two factors are not controlled e.g. the temperature around the cell becomes higher or lower than the optimum temperature, then the hydrogen bonds that keep the proteins tertiary structure will be broken [denaturing the protein]. Consequently, the proteins in the cell membrane are unable to function correctly. Therefore, a higher temperature will denature the proteins and diffusion will be able to take place easily due to the proteins being unable to manage what enters or leaves the cell.
The optimum temperature of the beetroot's normal working conditions should be around 40ðC. Therefore, if the temperature goes above this optimum temperature then the proteins in the cell membrane of the beetroot will become denatured and anything can enter or leave the cell.
Why beetroot?
I have chosen to use beetroot as my typical plant cell structure because it contains a pigment called betalain found in the vacuole which gives the beetroot its characteristic blue/purple colour. This allows a way of quantifying the permeability of the cell membrane because the more the membrane breaks down, the more pigment will escape and the darker the water solution will become.
Betalain pigments are polar molecules meaning they unable to pass through the phospholipid bilayer and can only pass through the special channel proteins by facilitated diffusion:
Diagram from Biology 1 Text book endorsed by OCR
This is where diffusion of large molecules is made easier by channel proteins. Channel proteins are specific and work both ways; the process does not require any energy.
The rate depends on:
vThe number of appropriate channels
vWhether or not the channels are open
The heat causes the channel proteins to become denatured and lose their shape. Consequently, the betalain molecules will escape with the increasing temperature.
Prediction
Referring to background knowledge, I can predict that an increase in temperature beyond 60ðC will denature the proteins of the plasma membrane and cause the cytoplasm and other substances contained within the membrane to leak out.
Due to the research I have carried out for the introduction, I have found out that increasing temperature on the cell membrane causes the channel proteins to denature and lose their shape. The temperature also increases the kinetic energy of the particles which increases the rate of diffusion. Consequently, it will affect the way the facilitated diffusion works and the betalain molecules will leak out - the higher the temperature gets, the darker the solution will become with the purple pigment. However, low temperatures should not affect the process because the channel proteins can still work under these conditions.
I think that when I plot the graph of results it will show a curved line, firstly decreasing slightly until it reaches a certain temperature (60ðC) where the proteins totally denature. This will show a dramatic drop in the graph.
Preliminary Study
Before carrying out the real experiment, I decided to do a preliminary study to gather further information for my plan and to learn from any experimental errors so I knew not to make the same mistakes in my real experiment.
From the results I gathered during this preliminary experiment (shown in results section) it is conclusive that I need to be more accurate with quantitative proportions e.g. when measuring out the distilled water solutions. Also, during this experiment I used a Bunsen burner to heat up the solution which does not stay at an accurate temperature so in the real experiment I will proceed to use an electrical water bath where I can maintain a steady temperature throughout the experiment.
Overall, apart from a few anonymous results most likely due to the reasons mentioned above, the pattern generally followed what I expected and links to the relationship mentioned in the prediction.
Variables
The temperature is the independent variable and will be increased by 20ðC each time. The colour of the solution is the dependant variable because it depends on the temperature that it is tested at.
Constants:
vSurface area - the surface area of the beetroot must be kept as exact as possible each time the beetroot cylinders are measured out. This will be done using a cork borer and a ruler.
vAmount of water - this is very important to be kept at a constant because it can affect the percentage transmission of light passed through the solution because it will be more dilute. This will be kept constant by accurately using a measuring cylinder
vTime left in water - if the beetroot is left in the solution for longer the betalain pigment will have more time to diffuse out into the solution. This will be controlled using a stop clock.
Method
Materials:
vBeetroot
vBeetroot plant corer (1cm in diameter) - used to cut out pieces of beetroot. It keeps the surface area of the beetroot pieces the same
vElectronic water bath - To maintain the temperature of the water required
vThermometer - used as a guide for the temperature in the water bath (ðC)
vColorimeter - Equipment used to measure the % light density. This tells us how much red pigment has been lost by the beetroot
vDistilled water - Constant pH and no impurities which may affect the reading
v4 test tubes - 1 of the test tubes is filled with distilled water to set the colorimeter to 0, while the other 3 are used to place the solution of the three red pigments in.
vKnife and scalpel - used to cut the beetroot pieces to length
vStop-clock - to time how long the beetroot is in the water bath for
vTest tube rack - Used to put the boiling tubes in when using the colorimeter
vRuler - to measure length of beetroot cylinders
Firstly the beetroot must be prepared to the chosen measurements (1cm wide and 2cm in length). This is carried out using a white tile, a corer, a ruler, and a knife. It is important that you use the same diameter corer each time to keep the surface area of the beetroot the same. Push the corer into the vegetable; withdraw it and push the beetroot chunk out with a corer of a smaller diameter. Now measure each cylinder to 2cm long and repeat this until there is enough beetroot to carry out 3 tests at each of the 5 temperatures. The beetroot has been cut through some of the cell membranes and broken them which means some of the betalain pigment will leak out. This must be completely washed off in order to maintain the reliability of the results.
Prepare 3 test tubes for the first temperature each containing 35 cm of distilled water - measure this using a measuring cylinder. A water bath must then be heated to 80*C - the maximum temperature for the experiment and once the water is at the correct temperature, put the 3 prepared test tubes of distilled water in the water bath and heat the water within the test tubes to the same temperature as the water bath. Once they are at the required temperature, place a piece of beetroot into each test tube at the same time and start the stop-clock. When 5 minutes is up, take the test tubes out and remove the beetroot from each one. The fluid in each of the test tubes is then analysed using a colorimeter and compared against the control, which is distilled water to check for any variations in the percentage of the light transmission through the liquid.
Now repeat this procedure for each of the remaining three temperatures: 60*C, 40*C, 20*C. However, the test for the 20*C can be carried out just using the normal room temperature.
I changed my method after carrying out the preliminary study because in that, I used a Bunsen burner to heat the water bath but found that it was extremely difficult to maintain it at a constant temperature. Therefore, I decided to use an electronic water bath where it is much easier to maintain the temperatures I wanted.
A colorimeter measures the percentage amount of light transmission through a solution. This is compared with a test tube of distilled water which is the clearest and most pure solution possible. I used a green filter in the colorimeter because it is a contrasting colour to the purple betalain pigment.
Risk Assessment
There are various safety hazards that are present during this investigation so some precautions have to be taken:
vTake care when using the apparatus to cut up the beetroot (corers and knifes are very sharp), use a white tile when preparing the beetroot
vTake care when experimenting with hot temperatures and handling the test tubes afterwards - use tongs to hold them with.
vIf using a Bunsen burner to heat water bath - wear safety goggles to protect eyes.
vTake care when using electrical equipment with water.
Results of colorimeter readings at varying temperatures:
Preliminary experiment:
Temperature (*C)Test 1Test 2Test 3Average
2085.089.084.086.0
4072.078.075.075.0
6050.056.053.053.0
8040.047.042.043.0
Real Experiment Results:
Temperature (*C)Test 1Test 2Test 3Average
2093.095.096.094.6
4082.085.087.084.6
6045.044.043.043.0
8030.032.031.031.0
Graph - on separate sheets
Conclusion
My graph shows that as the temperature increases, the percentage transmission through the liquid decreases. The percentage of light transmission at 20ðC is significantly higher than at 80ðC.
This is most likely due to the way in which the plasma membrane is not designed to cope with heat and when temperatures exceed certain temperatures, their structures begin to collapse and the cells begin to disintegrate. I can conclude this because of the way more and more pigment is leached into the solution at higher temperatures.
By referring to the graph you can see that the curve goes from the top left starting off slowly decreasing. Here the gradient of the line that I worked out on the graph is relatively horizontal at 0.5 between 20ðC and 40ðC. However, there is a dramatic fall in the light transmission as the temperature reaches 60ðC and the gradient of the line has become much more vertical at 2.08 between 40ðC and 60ðC. The gradient then decreases again after this becoming 0.6 between 60ðC and 80ðC.
Therefore we can conclude that the proteins of the cell membrane denature at 60ðC which agrees with the prediction that I made.
Under the extreme conditions of heat, the phospholipids bilayer begins to break up from the neighbouring molecules. I believe this happened as a result of the heat causing the molecules to vibrate faster so eventually the kinetic energy is enough to break up neighbouring molecules. As the kinetic energy increases due to an increase in temperature the protein's hydrogen bonds are broken in the proteins tertiary structure, which are there to keep the proteins shape. This denaturing enables the red pigment to easily diffuse out of the beetroot, so therefore as more proteins in the cell membrane denature more red pigment can diffuse out of the cell membrane into the surrounding water. This in effect causes 'holes' to appear in the membrane allowing the fluid to pass out freely without going through the process of facilitated diffusion.
In the second graph I have produced range bars between the preliminary results and the actual results. I have worked out the difference between the results at each temperature and then gained an average of the overall variation which is 10.05%. Consequently, there is quite a range in these results which shows that the preliminary experiment was not very accurate.
Evaluation
Overall, the investigation was successful and the results matched what I had originally thought in the prediction - An increase in temperature after 60 ðC will damage and denature the plasma membrane and cause the cytoplasm and other substances contained within the membrane to leak out. I can conclude that temperature and % transmission have a negative correlation. This means that as the temperature increases, the % transmission decreases.
I think it would have been beneficial to carry out more temperatures between the ones that I actually did because although I still got accurate results and a conclusive graph, more results would have provided more evidence and a more reliable set of data. It would have also helped to repeat the experiment more times at each temperature to gain a better range of results that would produce a more accurate average.
There were few anomalies in my results according to the averages but I took the reading of each temperature three times and the readings between these were quite varied. The slight changes of these readings are most likely due to slight experimental errors such as quantitative errors: use of beakers, measuring cylinder and the unlikeliest of being able to completely maintain a constant temperature within the water bath.
Another reason for anomalies could have been that when the beetroot was cut into pieces to be then placed in the boiling tubes, the cell membrane of the beetroot may have been broken resulting in red pigment leaking out of it. This would have caused excess red pigment on the beetroot. We tried to wash this excess pigment off the beetroot using distilled water, but you can't say that you washed the same amount of red pigment off each beetroot piece, therefore more excess red pigment may have been on some pieces than others. This excess pigment can easily get into the water in the boiling tube and as a result cause a higher reading on the colorimeter, and make our results less reliable. You have to cut the beetroot anyway so there is always going to be excess pigment on the beetroot but devising a method to reduce or control this excess pigment would have to be used to make the results become more accurate and reliable.
Also, the beetroot may have an uneven pigment distribution meaning that some parts of the beetroot contained more pigment than others. This leads onto the fact that cutting the beetroot also releases the pigments and leak out because you are physically cutting through plasma membranes. There was also not a beetroot large enough to obtain all the necessary pieces needed for the experiment so I had to use two beetroots making the results even more unfair. This is due to the fact that not all beetroots contain the same amount of pigment and can quite possibly contain a different structure completely. The equipment used can never be completely sterile so there may have been cross contaminations present affecting out results.
Another major problem is controlling the size of the beetroot piece, the pieces could not be the same mass, but have a very different surface area to one another. This obviously alters the effect of the experiment because the beetroot would be more exposed to the surrounding water so there would be a higher proportion of pigment that could leak out.
Using a beetroot as the sample is not a good representation of the whole eukaryote group. Other cell membranes may have better or worse heat tolerance, some may not be affected at all, however, using a beetroot does give a good representation of the theories behind the plasma membrane and how it behaves.
The measurement errors could be overcome by using more accurate equipment such as a pipette for measuring the amount of distilled water to go in each boiling tube rather than a measuring cylinder because it provides a far more accurate scale which would reduce the percentage errors of each reading. Apparatus such as a burette and pipette measure to an accuracy of + or - 0.05cm" whereas a measuring cylinder is only accurate to 0.5cm" which is quite a significant difference.
Also to improve the experiment, I would have to try and find a beetroot that was large enough to take all of the samples from. This would allow a fair distribution of pigment within the beetroot without having to use two where there is no guarantee of the relative amounts that each beetroot contains.
If I were to repeat the experiment again, I would definitely take all of the above factors into consideration to get a more accurate set of results but overall, the experiment was successful, I gained a reliable set of results that back up my predictions and enabled me to make an accurate conclusion.
References
÷Biology 1 text book endorsed by OCR
÷http://www.usd.edu/~bgoodman/Membrane.htm
÷biology.arizona.edu/sciconn/lessons/mccandless/reading.html
÷www.ac.wwu.edu/~grimesm/E1P.htm
÷www.cell-adhesion.net/discuss/wwwboard/messages/3.html
÷www.mansfield.ohio-state.edu/~sabedon/campbl08.htm
÷www.people.memphis.edu/~clessman/lect4cell.htm