Abstract:
This paper will review the automotive industry with a brief history of the industry with an overview and coverage of the strengths, weaknesses, opportunities, threats and trends. Included in this paper will be a discussion of the impact of the real GDP, the unemployment rate, and the inflation rate as measured by the CPI. A review of six economic indicators that influence the automotive industry will be discussed. This paper will describe the current status on each economic indicator along with separate graphs illustrating the historic and forecasted trends. A comparison and contrasts between 18 month forecasts for each will be discussed. A review and reconciliation of the differences of forecasts will be discussed and which forecast is deemed more accurate.
Finally, an analysis of how the forecast will impact the automotive industry with recommendations and strategic initiatives.
History and Overview
The automotive industry history has its roots in Europe.
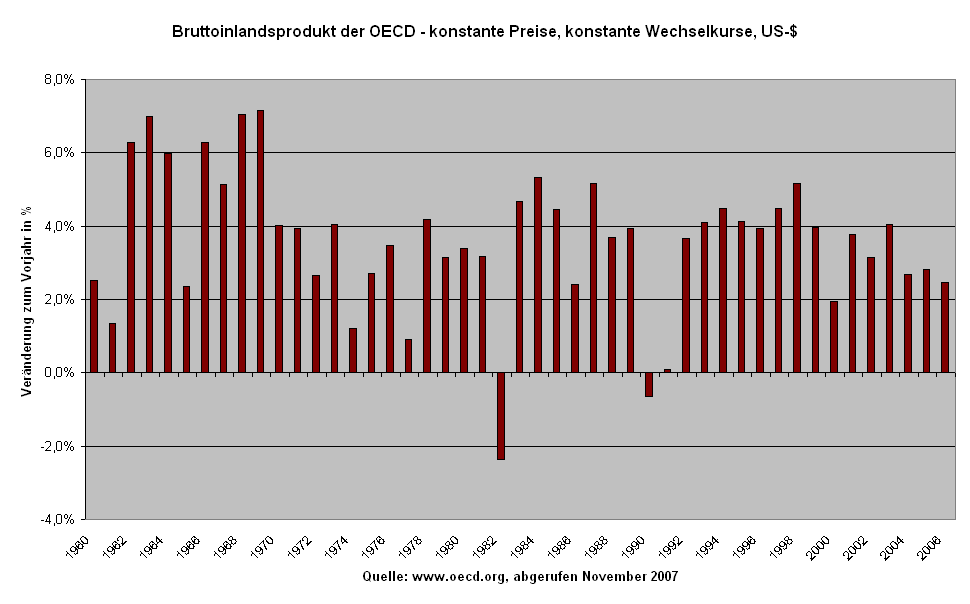 Gross Domestic Product (GDP) growth rate for OECD-...
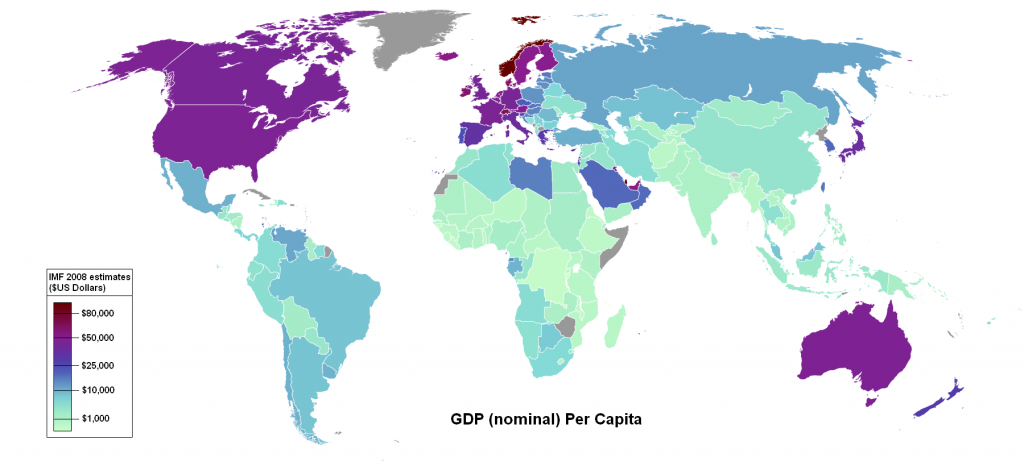 World map showing countries by nominal GDP per cap...
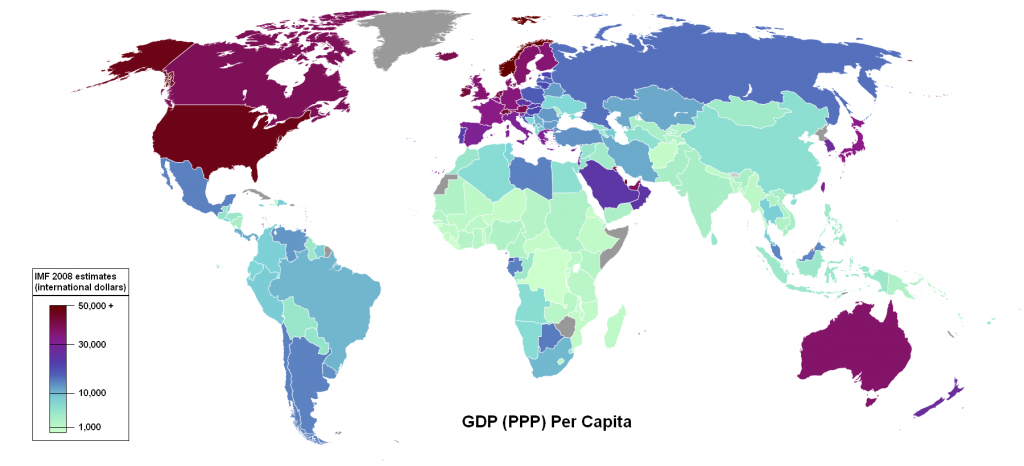 GDP (PPP) Per Capita based on 2008 estimates http:...
However, the first individuals to create a steam driven engine here in the United States were the Stanley Brothers of Massachusetts. They produced and marketed "The Stanley Steamer" from the 1890's until after World War I.
The early 20th century is when growth in the automobile industry as a whole took shape. A variety of new and different forms of engine styles transformed the industry. The internal combustion engines paved the way for gas powered autos of today. The mass production of the automobiles forced changes throughout the United States. Travel that typically took much longer created a personal freedom for the masses by the creation of extensive roads and highways.
The growth caused by the automobile industry in other industries was the steel, travel, and tourism industries. The development of larger shopping districts and the increased growth of suburban communities were also started
Strengths, Weaknesses and Trends
Some of the strengths of this industry are that they have a product that created a great demand for their product. This product created jobs for the masses as well as a freedom to travel and be a form of recreation. Some of the weaknesses were that this product created air pollution, is noisy, and a high rate of traffic fatalities. The new trend is to look for a better engine that creates less pollution, utilizes different methods of fuel and will be saver for the environment.
Real GDP
The gross domestic product (GDP) is the most important economic indicator. It represents a broad measure of economic activity and generally signals the direction of overall total economic activity. Gross Domestic Product (GDP) is a basic measure of a nation's economic output and income. It is the total market value, measured in dollars, of all final goods and services produced in the economy in one year. When desired, expenditures for consumption, investment, government spending, and net exports are less than the value of a nation's output of final goods and services, the GDP decreases and inflation and/or employment decreases. After a decade of record sales and corporate profits, purchases of cars and trucks fell sharply in the fourth quarter of 2000. One reason was rising fuel prices, the fall on the stock market, worries about job security and a decrease in consumer confidence. Some analysts say it wouldn't be surprising that after 10 years of booming sales, where on average every household in the United States has replaced one and a half new cars, consumers will cut spending for the next several years.
The real impact of the GDP for a nation is determined by the quantity and quality of its natural resources, the size and skills of its labor force, and the size and quality of its stock of capital resources.
1st Qtr 21%
2nd Qtr 17%
3rd Qtr 17%
4th Qtr 26%
The gross domestic product is the output of goods and services produced by labor and property located in the United States. During the 2004-2005 there was a reflection of 3.8 percent increase due to increase in personal consumption expenditures, exports, private inventory investments, residential fixed investments, and equipment and software. Imports which are a subtraction in the calculation increased as well.
Gross domestic products revealed for 2002-2003 only reflected increases between 2 and 3 percent for that time frame.
Why are we experiencing such a high level of GDP scores for 2004-2005? This may be answered by looking at the supply curve if there is a shift to the right it will mean that the countries standard of living is increasing for all consumers and supply and demand reflects the changes in the GDP.
Inflation Rates
Just what is inflation, this ravenous beast that eats away at the value of every dollar you earn? It is essentially the increase in the price of any goods or services. The most commonly referenced measure of that increase is the Consumer Price Index (CPI), which is based on a monthly survey by the U.S. Bureau of Labor Statistics. The CPI compares current and past prices of a sample "market basket" of goods from a variety of categories including housing, food, transportation, and apparel. A plunge in energy costs pulled U.S. consumer prices down 0.1% in May, first drop in 10 months. Even excluding volatile food and energy prices, the core consumer price index rose a smaller-than-expected 0.1% last month, the Labor Department said. Economists had expected overall consumer prices to hold steady and prices outside food and energy to rise 0.2%. The decline in its closely watched Consumer Price Index followed big gains of 0.4% in February, 0.6% in March and 0.5% in April. Those increases had been driven by a surge in energy costs as crude oil prices hit all-time highs in early April. A penny saved is a penny earned, right? Not necessarily. Thanks to inflation, over time that penny could be worth less than when it was first dropped into the piggy bank. In just 20 years, 4% inflation annually would drive the value of a dollar down to $0.44. Under the same conditions, the $21,000 automobile you just took for a test drive would soar to more than $46,014.
Jan 0.1
Feb 0.2
Mar 0.4
Apr 0.6
May 0.5
As can be seen in the tables below, inflation rates seem to be higher in the summer months than in the winter months. This can probably explained in the same manner as unemployment, the more vehicles produced and demand for them is higher during summer months which history indicates is the favorite time to purchase a new vehicle. During winter months, production falls off because the demand is not as high.
The table that I feel is the most accurate would be the most accurate would be the period between January 2005 and May 2006. It seems to be the most consistent with the historical rates of inflation.
Area: U.S. Michigan average inflation rates
Item: Private transportation
Base Period: Jan-Dec 2005-2010
Year Jan Feb Mar Apr May Jun Jul Aug Sep Oct Nov Dec Annual
2004
2005 99.9 100.7 103.0 102.7 102.7 104.1 103.7 102.5 103.7 103.8 104.2 103.6 102.9
2006 103.5 103.7 103.1 104.7 106.7 106.0 103.3 102.6 104.2 102.3 101.0 99.5 103.4
2007 99.7 99.5 101.0 103.2 103.1 102.8 103.1 103.2 103.4 104.1 104.2 103.4 102.6
2008 104.4 106.7 108.0 106.7 105.1 104.8 104.6 105.7 106.5 105.0 104.1 103.5 105.4
2009 105.0(U) 106.1(U) 107.1(U) 107.8(U) 109.7(U) 109.8(U) 108.8(U) 108.4(U) 108.6(U) 110.6(U) 111.2(U) 110.0(U) 108.6(U)
2010 109.6(I) 110.8(I) 112.1(I) 114.3(I) 113.7(I) 113.7(I) 112.1(I) 112.3(I) 112.4(I) 114.3(I) 115.1(I) 113.3(I) 112.3(I)
U : Interim
I : Initial
Unemployment Rates
The number of capable working individuals who are currently looking for employment is called the unemployment rate. This economic indicator looks at the rate of unemployed in each sector of occupations, industry, the time frame of unemployment, and reasons why they are unemployed. This indicator shows the trends in the industry. If production and employment is high then the rate of unemployment is traditionally lower. The lower the unemployment rate or declining trend is considered "inflationary, and can cause bond prices to fall and yields and interest rates to rise." (mortgage-x.com 2005)
The Big Three U.S. auto companies--Ford, General Motors and DaimlerChrysler--have all reduced first-quarter output between 17 and 26 percent. Over several months time period, GM announced plans to permanently cut 15,000 jobs worldwide; Ford announced that it would eliminate 4 to 5 percent of its workforce, primarily through attrition; and DaimlerChrysler announced it was permanently cutting 26,000 jobs at its US-based Chrysler Group. In the state of Michigan, unemployment rate went back up to 7.5 percent in February, 2005 after dropping to 7.1 percent for one month.
In addition to permanent job cuts, General Motors also temporarily closed 14 of its 29 plants in North America, with several plants closing for as long as five weeks. GM cut production by 21 percent after acknowledging that it had a 102-day supply of vehicles in dealers' parking lots, instead of the 60-day norm. All of this contributed to a great extent to the unemployment rate of the auto industry. The number of payroll jobs in Michigan went up by 10,000 in February to nearly 4.4 million, mostly due to the addition of 9,000 manufacturing jobs. The increase in the manufacturing sector is due to recalls from short-term layoffs in the auto industry. Seasonal job cuts were somewhat larger than what is normally expected for July in both auto-related manufacturing and local government education. Usually, short-term layoffs occur in manufacturing in July due to yearly retooling for model changeovers in the auto industry. So this also contributes to the rise in unemployment.
The current status of unemployment in the State of Michigan has risen to a 7.1% in May, with a total employment drop of 15,000 workers as reported by state officials. Michigan has added 2,000 manufacturing jobs but that is still 20,000 jobs below last year's figures. (Michigan Department of Labor & Economic Growth)
Unemployment Rates
Jan 7.1
Feb 7.2
Mar 7.1
Apr 7
May 7.1
Jun 7.1
Projected unemployment rates in the eighteen month period of 12-2005 until 05-2007 are as follows:
2005-12-01 25273
2006-01-01 25348
2006-02-01 25367
2006-03-01 25441
2006-04-01 25481
2006-05-01 25511
2006-06-01 25536
2006-07-01 25536
2006-08-01 25537
2006-09-01 25555
2006-10-01 25581
2006-11-01 25621
2006-12-01 25620
2007-01-01 25652
2007-02-01 25714
2007-03-01 25743
2007-04-01 25793
2007-05-01 25824
Another forecast for unemployment rates in the same period of 12-2005 until 05-2007 might be as follows:
2005-12-01 25529
2006-01-01 25544
2006-02-01 25483
2006-03-01 25438
2006-04-01 25440
2006-05-01 25418
2006-06-01 25418
2006-07-01 25376
2006-08-01 25360
2006-09-01 25308
2006-10-01 25306
2006-11-01 25282
2006-12-01 25249
2007-01-01 25232
2007-02-01 25241
2007-03-01 25279
2007-04-01 25298
2007-05-01 25282
The unemployment rates in the summer months in the first forecast stayed pretty close, only going slightly higher in August, 2006 than in June and July. The winter months varied more ranging from 25273 in December of 2005 at the lowest and the highest unemployment rate in March of 2006 at 25743. The explanation of the variation could be explained by more production in the summer months than in the winter, thereby needing more employees. In the second forecast, there are two periods of winter and only one of summer causing the figures to fluctuate even more. The summer months of 6-2006 until 08-2006 there is more instance of fluctuation between June and August 2006. The higher fluctuation rate could be explained by higher inflation rates and falling prices of the product, utilizing fewer employees to produce the vehicles.
In the winter months, the period between 12-2005 and 02-2006 the unemployment rate starts relatively high, and then falls slightly in January, only to rise again in February. The period between 12-2006 and 02-2007 stays pretty constant, falling slightly in January. In the winter months, unemployment tends to be higher because of the lower production rates. The less of a product that is manufactured, the fewer employees are needed to do the job.
The forecast that I would chose as the most accurate would be the first forecast, since it seems to have the figures that are the most consistent with the history of unemployment rates.
Auto Sales
One of the three economic indicators affecting the automotive industry is auto sales. In May 2004, total auto sales equaled a 17.7 million dollar annual rate and domestic sales were at 14.1 million. However, U.S. auto sales were weakened in May, mainly because of investor apprehension regarding the recent credit downgrades at two of the Big Three companies. This was in lieu of an eight week decline in gasoline prices. However auto sales stabilized at the year-to-date sales level (Dow Jones Newswires). According to reports from Dow Jones analysts, total auto sales were in a 16.5 to 16.7 million dollar annual rate range in May, with U.S. generated sales quoted at a 13.2 million dollar annual rate compared to 13.8 million dollars in April (Dow Jones Newswires). Economists surveyed by Dow Jones Newswires anticipated a moderate decrease to a 16.7 million dollar annual rate for auto sales in May after a 17.4 million dollar rate in the month of April (Dow Jones Newswires). The overall sales estimate is at the level of or slightly below the 16.7 million selling pace in the first four months of the year and the 13.4 million dollar annual rate for U.S. produced automobiles. Last year, total auto sales were at a 16.8 million dollar annual rate, while U.S. produced cars and light trucks sold at a 13.4 million annual rate (Dow Jones Newswires). The automotive industry totals include 22 automakers. The top auto companies posted declines in sales for the month. General Motors Corporation total U.S. sales in May fell 5% on an adjusted basis. Ford Motor Company reported May vehicle sales down 10.5% from last year on an unadjusted basis (Dow Jones Newswires). Percentages are based on the daily sales rate; there were 24 sales days last month and 26 sales days in May 2004, and 126 sales days for the first five months of 2005 and 128 days for the same period a year ago (Detroit Free Press 6-1-2005). The top auto companies posted declines in sales for the month. The auto sales industry is currently a buyer's market and automakers are counting on dealer inventories to decrease. GM's sales were down 12.6% in May compared to May 2004. Ford sales were off 10.6% in May, and DaimlerChrysler, which includes Chrysler Group, reported U.S. sales off 2.5% (www.freep.com).
2002 2003 2004 2005
Total Sales 16.3 16.5 16.5 16.7
U.S. Sales 13.2 13.3 13.4 13.8
20 year graphical presentation of Light Truck Sales
Group: Transportation equipment
Item: Trucks, 14,000 lbs. and under
A 20 year graphical presentation of Passenger Car Sales
Group: Transportation equipment
Item: Passenger cars
In comparing auto sales for 2003 and 2004 and the time frame of 2000-2001 we see a vast difference. 2000 and 2001 auto manufacturers revealed soaring auto sales especially during October 2001. Much of the reasoning for the new sales was due to financing options that made new car sales so attractive, the zero-percent financing and incentives to return buyers influenced new car sales at a torrid pace.
October 2001 reflected the highest sales levels in 15 years for GM with a spike of 31.2 percent for that month alone. GM's truck sales for that same time frame reflected an all-time monthly sales record of 47 percent. Ford and Chrysler did not reflect nearly the same record sales but they also showed increased sales from other years.
Even though gas prices are continuing to climb the new sales of vehicles for 2004 - 2005 are not slowing either. GM has had record light-duty truck sales for the month of June, 2005. Other auto makers reflect new car sales as increasing for this time frame also. New vehicle retail sales revenue increased 9.4% during this time frame also.
Product Price Index
The Producer Price Index of the Bureau of Labor Statistics (BLS) is a unit of indexes that measure the average change over time in the prices received by domestic producers of goods and services. PPI measures price change from the perspective of the seller. This differs from other indexes, such as the Consumer Price Index (CPI). CPIs measure price change from the purchaser's perspective. Sellers' and purchasers' prices can differ due to government subsidies, sales and excise taxes, and distribution costs. (www.bls.gov). The PPI is composed of indexes of a vast amount of different products. There are many products and goods involved in producing automobiles. The Producer Price Index for Finished Goods advanced 0.6 percent in April, seasonally adjusted, the Bureau of Labor Statistics of the U.S. Department of Labor reported. The index for finished consumer goods other than foods and energy increased 0.2 percent in April, after a slight increase of 0.1 percent in the prior month. Among various finished consumer goods, higher prices were also reported in April for light motor trucks and passenger cars.
GM Ford Chrysler Toyota
2001 0.28 0.28 0.27 0.26
2003 0.23 0.19 0.18 0.18
2004 0.16 0.13 0.13 0.14
2005 0.1 0.11 0.12 0.11
Producer Price Index-Commodities
Group: All commodities
Item: All commodities
Base Date: 8200
The Producer Price Index is considered to be a good indicator of inflation. The PPI measures the average change over time in the selling prices received by domestic producers for their output. The prices included in the PPI are from the first commercial transaction for many products and some services. Each month approximately 100,000 prices are collected from 30,000 production and manufacturing firms.
The PPI excludes prices for imported goods; therefore it does not necessarily detect producer prices for companies with operations in other countries.
Below is a 6 month forecast of all commodities. This forecast has the PPI at the 155 range by year's end. This is nearly even to where it's current level of 154.4
Producer Price Index: All Commodities
This chart is forecasting the PPI to be around 155.1 in the fourth quarter.
U.S. Producer Price Index, PPI, Forecast. All Commodities, NSA. 1982=100.
Jun
2005 Jul
2005 Aug
2005 Sep
2005 Oct
2005 Nov
2005
Value 151.9 153.2 153.0 153.0 154.3 155.1
U.S. Producer Price Index Past, Present
Headline PPI Inflation Imported PPI Inflation Local PPI Inflation
YOY - % YOY - % YOY - %
Actual
2000-05 8.7 13.5 7.1
2000-06 8.8 14.0 7.0
According to the economic indicators stated with retails sales, high oil prices, inflation, interest rate increase, I would expect the PPI index to decline in six months.
Dow Jones Average
The Dow Jones Indexes develops, maintains and licenses market indexes for use as benchmarks and as the basis of investment products. Among its more than 3,000 indexes are the world's best known stock indicator, the Dow Jones Industrial Average, and the leading Pan-European indexes (www.djindexes.com).
There are three major weighting methodologies that are used in the construction of equity indexes: cap weighting, equal weighting and price weighting. The Dow Jones Industrial Average is price-weighted. The Dow has been price-weighted since its inception in 1896 and has historically moved in tandem with other major market indexes such as the S&P 500.
The Dow's exceptional performance can be attributed to its stock-selection method and its price-weighted calculation. The strong relative performance of The Dow since 1999 comes from the combination of superior stock selection skills and a unique weighting approach (www.djindexes.com).
Dow Jones Average Chart
The market displayed remarkable flexibility after the most recent decline, as positive manufacturing data eased investors that the economy can still grow despite the possibility of increasing interest rates and higher energy prices. Today stocks opened higher on the idea that after Thursday's wide spread selling attempts, the Fed gave no indication of an end to further reduction, otherwise may have been an over reaction. The Dow closed at 10,303.44, up 28 points. The NASDAQ closed at 2,057.37 up .41 points or 2%.
Below is a 6 month forecast of the value of the Dow Jones Industrial Average. This forecast has the Dow at 10,662 by year's end. This is nearly 300 point higher than today's close. The NASDQ is forecasted to close at 2015. This is 40 points lower than today's close.
Dow Jones Industrial Average, DJIA, Stock Index,
Jun
2005 Jul
2005 Aug
2005 Sep
2005 Oct
2005 Nov
2005
Value 10,651 10,734 10,346 10,551 10,773 10,662
NASDAQ
The NASDAQ is the largest U.S. electronic stock market. With approximately 3,300 companies, it lists more companies and, on average, trades more shares per day than any other U.S. market. It is home to category-defining companies that are leaders across all areas of business including technology, retail, communications, financial services, transportation, media and biotechnology. NASDAQ is the primary market for trading NASDAQ-listed stocks. Approximately 54% of NASDAQ-listed shares traded are reported to NASDAQ systems (www.nasdaq.com).
The NASDAQ Composite Index measures all NASDAQ domestic and non-U.S. based common stocks listed on The NASDAQ Stock Market. The Index is market-value weighted. This means that each company's security affects the Index in proportion to its market value. The market value, the last sale price multiplied by total shares outstanding, is calculated throughout the trading day, and is related to the total value of the Index.).
NASDAQ Composite Chart
NASDAQ Composite Stock Index Forecast, Close of Month.
Jun
2005 Jul
2005 Aug
2005 Sep
2005 Oct
2005 Nov
2005
Value 2,036 2,033 2,008 1,925 1,999 2,015
This chart shows a forecast at the beginning of this year and shows the Dow Jones closing at 10,617 by the year's end.
U.S. NASDAQ Composite Stock Index Outlook
Anticipated Indicator Values
Jun 05 Jul 05 Aug 05 Sep 05 Oct 05 Nov 05
2036. 2033. 2008. 1925. 1999. 2015.
While it still seems more rate hikes are probable, the Fed's policy remained positive on the economy, citing growth remains concrete, labor market conditions continue to improve and long-term inflation expectations are controlled. The administration stated the nation's economy would likely grow at a slower pace than forecasted six months ago . Retail sales experienced their worst year-on-year decline in June, Oil prices are still at records highs, and housing fell for the twelfth month in a row. From these findings, I would expect the prices for both the Dow Jones Industrial and NASDAQ to fall from there current prices in eighteen months
Forecasts and Recommendations
One key to continued growth for automakers will be developing strategic alliances with suppliers in Europe and around the world but, there is a milder inflationary problem brewing. The slowdown forecasted will fail to spoil inflationary pressures in labor markets, especially in benefit costs, which were the primary push on inflation in the late 1980s. I would expect that inflation will decrease slightly at the core level mid-2006, only to begin a modest re-acceleration in late 2007 and into 2008. By the end of 2008, we will easily see the core rate of inflation move up from its current range. That means a window for additional Fed easing, but a year from now, this would put a lot of money of the fact that the discussion among most will be how high rather than how low rates will go.
Car manufacturers regularly adjust their work force to coincide with the schedule of their customers. Spring is generally one of the stronger selling seasons of the year because people are buying in anticipation of summer vacations and warm weather. The spring selling season typically runs from March to June. However, numerous consumers have steered clear of dealer showrooms because of a stressed economy and low consumer confidence. With layoffs looming at many companies, buyers are less likely to buy big ticket items like cars.
Incentives also aren't as effective as they used to be. Although incentives are as robust as ever, consumers expect big price breaks on vehicles. As a result, they aren't as appealing. Incentives per vehicle steadily increase as automakers have attempted to head off a slowdown in vehicle sales. In May, incentives averaged $2,724 per vehicle, up more than $1000 from May of 2002, according to sales analysis firm Autodata.
Experts say the combination of slumping sales and hefty incentives could be devastating for an already sluggish industry. High incentives can impact the bottom line because the automakers make less money on each vehicle they sell. Companies have long reached the point of diminishing returns. Incentives stimulate sales, but not as much as they used to.
Conclusion
The automotive industry had a profound role in the shaping of the economic history of this country. The affects of the automotive industry whether positive or negative has similar influence on a multitude of other industries. Products such as steel, plastics, glass and rubber are dependent on the health of the automotive industry. Other industries such as manufacturing and financing rely on the good health of the automotive industry. The automotive industry indirectly may be considered an economic indicator of how well the economy is performing. Currently with weaken sales, higher employment rates the automotive industry will again survive and thrive into that robust industry.
References
JOHN GALLAGHER. August 18, 2004. Michigan Unemployment Rate Worsens.
Detroit Free Press. Accessed June 14, 2005 at www.freepress.com
The Columbia Encyclopedia, é Columbia University Press 2004, Retrieved from the World Wide Web, June 14, 2005
Michigan Department of Labor & Economic Growth, retrieved from the World Wide Web, June 22, 2005.
Hoffman, Kathy Barks (2005) Michigan's Unemployment rate rises in May.
Mortgage X, Mortgage Information Services, www.mortgage-x.com/general/indicators.asp, Retrieved from the World Wide Web, June 22, 2005.
http://www.djindexes.com/mdsidx/index.cfm?event=showAverages
Detroit Free Press June 18,2005
Economic History Services, www.eh.net/hmit/gdp/ retrieved from the World Wide Web, July 1, 2005.
GM: Record light truck sales in June, CNNMoney, July 1, 2005, retrieved from the World Wide Web, July 1, 2005.
October auto sales soar, November 1, 2001, CNNMoney, retrieved from the World Wide Web, July 1, 2005.
NASDAQ Composite, accessed 6-25-05;7-01-05 http://finance.yahoo.com
Bureau of Labor Statistics, accessed 7/01/05 http://www.forecasts.org/djia.htm
The Financial Forecast Center, accessed 7/01/05 http://marketvector.com/stock-market/dow-jones-industrials.htm
Associated Press; Stocks Decline on White House Forecast access 7/1/05
http://www.forbes.com/associatedpress/feeds/ap/2005/06/08/ap2083559.html
U.S. Department of Labor: Bureau of Labor Statistics; access 6/26/05;7/1/05
http://research.stlouisfed.org/fred2/series/PPIACO/31
U.S Department of Labor, Bureau of Labor Statistics accessed 6-29-05
http://data.bls.gov/PDQ/outside.jsp