Checking out the performance of any national economy around the world one can notice a large amount of imbalances from year to year and some numerical gaps which most of the time, no matter what they cannot be covered. Each government in the world chooses to present different aspects of the economy in order to show that the economy is either doing well or not. In order for something like that to happen the government must present the GDP, the national budget deficit or surplus, the inflation rate, the unemployment rate and always to present net exports. It is also important for each economy to acknowledge where there are problems in the economy and how these problems can be faced in order for the next fiscal year to be more prosperous than the one that went by.
In the following economical research project we are going to study and analyze the basic criteria of the performance of a certain country.
 United States
 English:
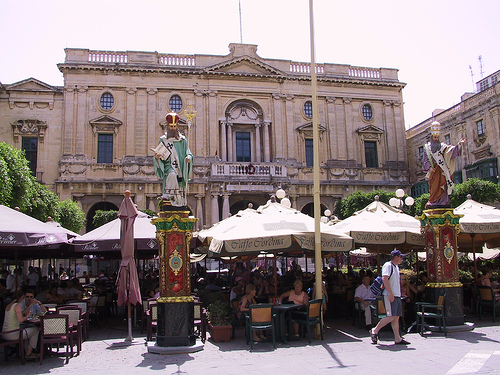
 Malta "La Valleta" Valleta
We are going to look at the GDP, the GDP in terms of growth, the government debt, the evolution of the balance of payments during the years being studied and the evolution of the exchange rate in terms of the US dollarThe economy which has been chosen to be analyzed is that of Malta. It was chosen because it is an island and so, the economy, logically is a closed one. To my surprise, economy of Malta is everything but a closed economy, since all basic needs of the citizens of Malta are covered by imports, since only 20% of the gross food needs are covered by in-state production. So, from the year 1998 until the year 2002 the balance of payments was -$130mn. This shows that the imports in Malta were much larger than the imports, which creates a budget deficit in the country. In general, this means that Malta owes to the US, Italy, Germany and France (MaltaÃÂs basic trade allies) a total of $130mn,If we notice the GDP of the country during these 5 years, we will notice that there is a GDP overall growth rate at 2.2% in total. This shows that the purchasing power of the Malta citizens grew from 1998 to 2002 by 2.2%. This has as a result for the year 2002 for the purchasing power parity of the government of Malta to be at $7bn and the per capita purchasing power parity at $17,000. The division of the GDP by sector is at 2.8% for the agricultural, 25.5% for the industrial and 71.7% for the services. This shows us that Malta has a large labor force in the service sector. As previously stated, there was a budget deficit of $130mn by the end of 2002 which is approximately 1.3% of the GDP for that year.
The fact that the government has this large of a debt for these years shows that the net imports of the country were by much larger than the small amount of exports during that period of time. We notice, although, that the debt drops from year to year and so we have a debt of the scale of $168mnin the year 1998 and a debt of the scale of $130mn in 2002. This shows the increase of export production in Malta during the years. This also has a positive influence on the unemployment rate, since in 1998 it was at 9.2% and in 2002 at 7% of the total labor force.
The balance of payments comes down to the following table and diagram which analyzes the balance of payments from 1998 until 2002. Note that the numbers are in thousands of Malta Lira (Lm).
The table above shows us that Malta was mostly in debt during the 5 years being studied. This means that the country had more imports than exports and also more national expenditure than revenue, which money is being spent on the development and upgrading of the country. This may have a negative effect on the economy, but it has a positive influence on the wellbeing of the citizens.
The economy of a country is reflected from the exchange rate that it has with the main strong currencies of the world. The strongest currency for the past 60 years has been the US dollar ($US), and so, the comparison we are going to make is on the exchange rate between the $US and the Lm.
This diagram shows us the rates at which the Malta lira is sold for one US dollar. As we can see, the relationship began from 0.385, rose all the way to 0.4501 and then dropped down to 0.4336 in 2002. This shows us a relatively smooth transition between t years in terms of the exchange rate and so, we can say that, especially in 2001 the Malta lira had a quite large demand in terms of the US dollar. This is very possible, since, as previously stated, the largest economic ally of Malta is the United States, and so, most trades of goods of Malta are with the United States, so the Malta lira has demand in terms of the dollar.
We can see from the two figures above, that as the BOP drops or rises, the exchange rate falls or goes up respectively. This is very logical, since when there is a large budget deficit, a large drop in the currency takes place, so that the demand of the currency increases and so, the national debt is taken care of. It is also very possible that when a country has a budget surplus, for an increase in the exchange rate to take place.
Concluding we can notice that in general, the economy of Malta has a relatively (compared to other countries) stable economy. This is very possible because Malta is in the process of entering the European Currency Union. Due to this, the government has to meet certain requirements, such as that it has to have a relatively stable economy and the national debts to be at a certain, relatively low point. This is very important for Malta, since the entrance in the EU will open new economic frontiers for the country, as it will have as economic allies all the members of the EU. This will have as a result, an increase in exports (possibly), but most importantly cheaper imports, since taxation on imported products will be abolished. The general picture that Malta presents is one that can create an image of a steadily growing economy, especially since the inflation rate is steady around 2%.
BibliographyTreasury Budget Office of Maltawww.nso.govwww.cia.govEconomics by Gregory N. Mankiw
 Malta 171
 United States