TMA 02
QUESTION (a)
i) Which column do you need to look at to see how rich and how poor countries are? In 1990 which countries would you class as rich and which as poor? How has this changed by 1996/97?
To see how rich and how poor countries are you would need to look at the GDP (PPP$ per capita). This is because this column revolves around the average income for a particular country and touching upon the economic wealth of that country. By looking at the 1990 table we can see that the poorest countries were India, with 1,399, and Indonesia, with 1,887 compared to the richest countries like the United States, with 22,388, Germany, with 19,255, and Japan, with 19,181. In 1996/97, there wasn't a considerable change regarding these figures as the richest countries previously mentioned were still the richest, with the US average income increasing by 7,000.
 English: A colour version of previous map, ranking...
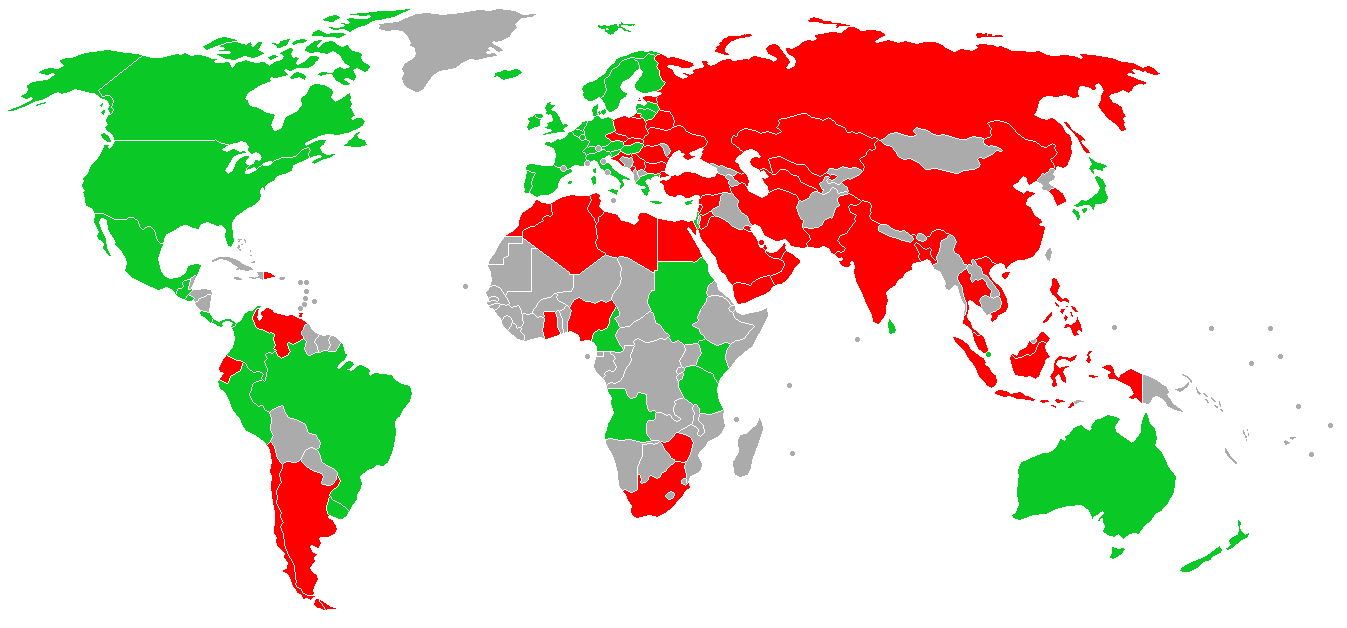 Ratio of GDP to carbon dioxide emissions
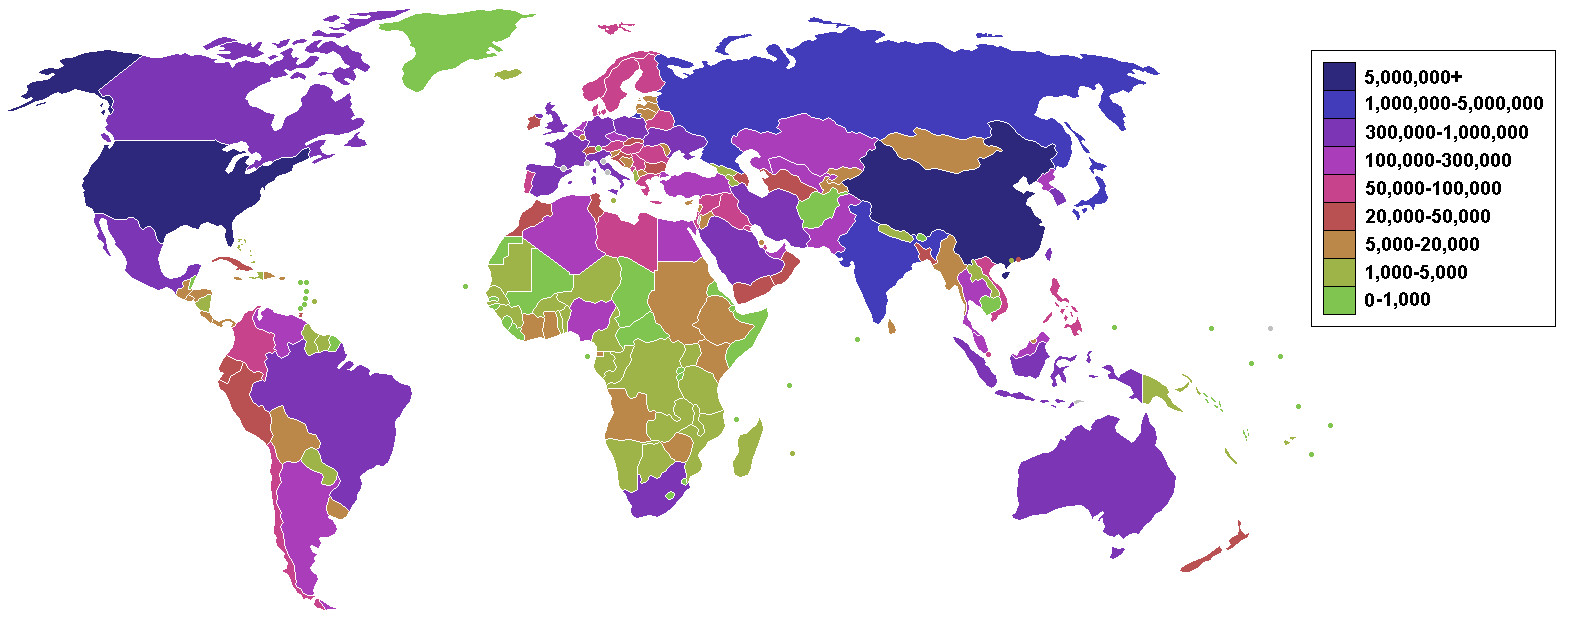
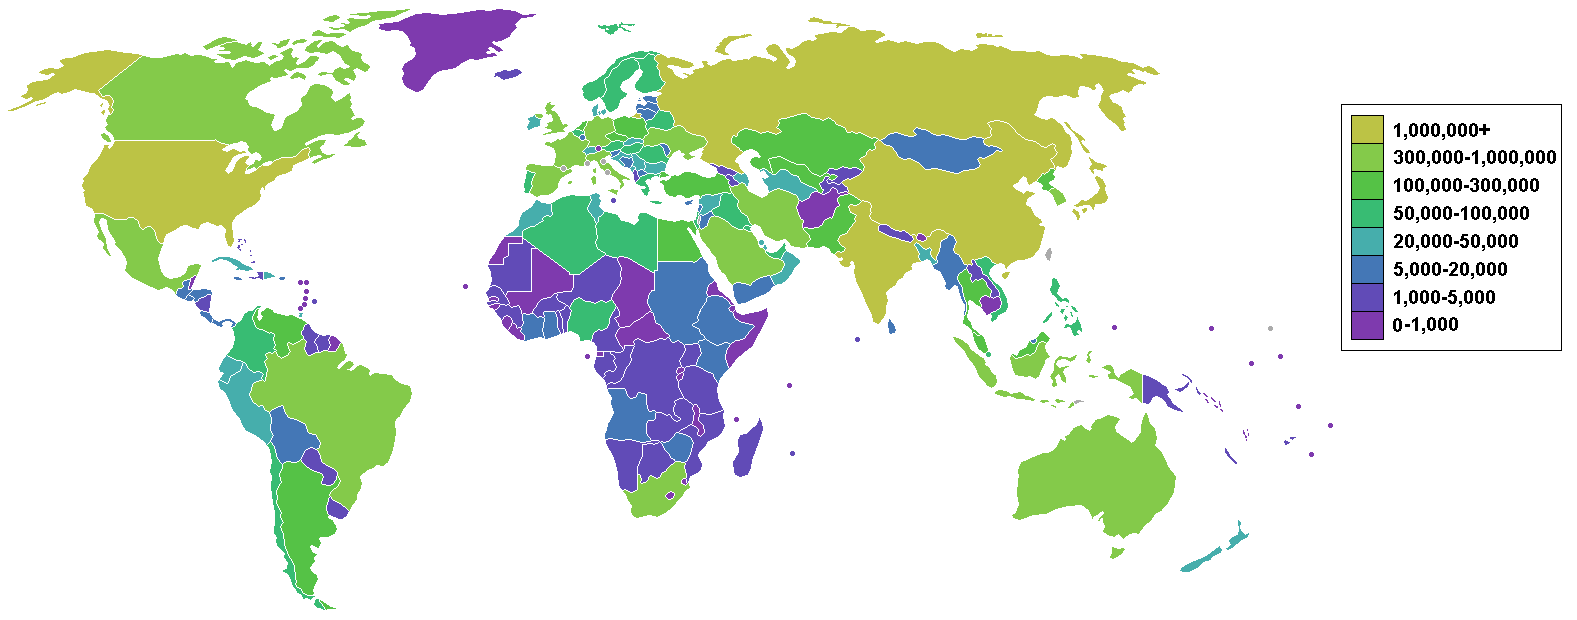 Countries by carbon dioxide emissions world map
The poorest average income had also increased but not as considerably as the richer countries (by about a thousand).
ii) What does the column headed "Carbon dioxide emissions (metric tons per capita)" measure? For which countries did this decrease between 1990 and 1996/97?
"Carbon dioxide emissions (metric tons per capita)" measures the average amount of carbon dioxide emitted from a particular country measured in metric tons. This is worked out by dividing carbon dioxide emissions by population. This decreased significantly for Ukraine, by 4.3, followed by Russian Federation from 13.1 to 10.7. Also small decreases for Germany, South Africa and United Kingdom.
iii) What does the column headed "Carbon dioxide emissions (metric tons per PPP$ million GDP)" measure? What do you think is the significance of this measure? For which countries did this decrease between 1990 and 1996/97?
"Carbon dioxide emissions (metric tons per...