Weather maps, or synoptic charts, can appearrather complicated. But when you know what thelines and symbols mean you will and these mapseasy to use.
One of the most important features of the atmosphereand one that is very frequently measured isair pressure, or the weight of the air. All air hasweight. While we can't feel it because we are constantlysurrounded by it, sensitive instrumentscalled barometers can measure the air pressure.
Atmospheric air pressure measurements aregiven in hectopascals (hPa). Several times a day,air pressure is read at various weather stationsaround the world. Many observers around Australiameasure air pressure and other aspects ofthe weather and send them to the national andregional centres of the Bureau of Meteorology.
These observations are combined with othersmade from satellites, aircraft, ships at sea and inother countries to prepare weather maps.
The main lines that we see on weather mapsare called isobars. Isobars are lines joining placesof equal pressure.
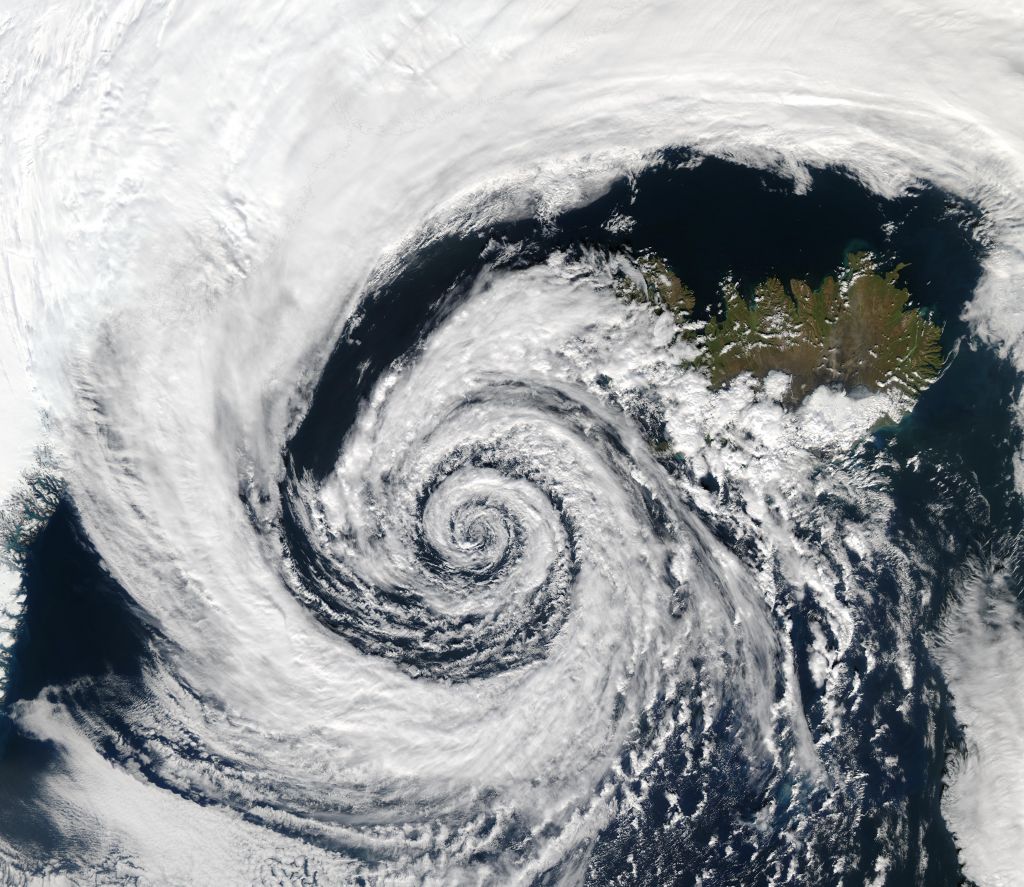 A large extratropical low-pressure system swirls o...
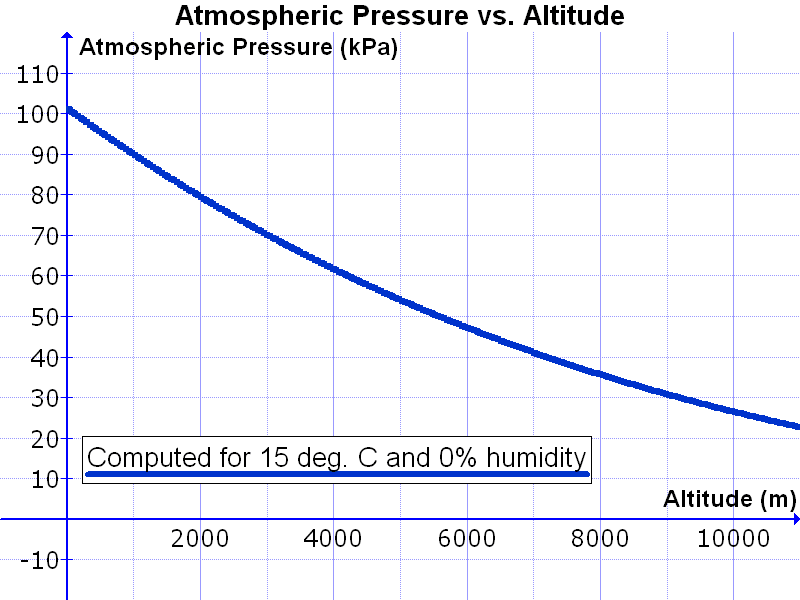 English: Graph of atmospheric pressure (in kPa) vs...
 diagonal-gradient-level-1-menger-sponge.2
Highs and lowsThe average weight of air at sea level is 1013 hPa.
If air pressure measures more than 1013 hPa, it isusually an area of sinking air and is generally anarea of high pressure. High pressure systems areoften called anticyclones. You can see from thetable opposite what a high pressure system lookslike and the anticlockwise direction the air travelsin a high pressure system. The moving air, knownas wind, always moves out of a high and into a lowpressure system.
If air pressure measures below 1013 hPa, it isusually an area of rising air, and is generally anarea of low pressure. Low pressure systems areoften called cyclones. You can see in our table whata low pressure system looks like and the clockwisedirection the air travels in a low pressure system.
Pressure systems generally move from west toeast as they move across Australia and around theworld. As they move they change in shape andoften change their latitudinal position.
PRESSURE SYSTEMSSometimes people confuse pressure systems withair masses. An air mass is a large section of theatmosphere containing air with a similar temperatureand moisture content. A line drawn on aweather map to show where two different airmasses meet is called a front. There are two maintypes of fronts: cold fronts and warm fronts.
When we look at the direction of winds on aweather map we can work out if temperatures arewarmer, cooler or about normal for the time ofyear. In Australia, a northerly wind (coming fromthe north) means warmer than normal temperaturesand a southerly wind, cooler than normaltemperatures. Easterlies and westerlies meantemperatures that are around normal.
AIR MASSES AND FRONTSWINDS AND TEMPERATURESAMPLE STUDYSnowfalls to the south and centralranges of south-eastern AustraliaThe weather map below for 30 July 2003 shows acold front moving into the Tasman Sea that hasbrought a `cold snap' to south-eastern Australia.
Cold and moist air from the ocean to the south ofAustralia moved across Tasmania, Victoria andNew South Wales bringing extensive snowfalls tothe higher parts of the tablelands and ranges.
Over 40 centimetres of snow fell in the SnowyMountains and therewere falls of up to20 centimetres overthe CentralTablelands. Whilesuch snowfalls arewelcome news forskiers during thewinter months,they often createdifficult conditionsfor graziers whomust take earlyprecautions to protecttheir sheep from thevery cold weather. Weather map, 30 July 2003http://www.icms.com.au/inqua2007/abstract/192.htmhttp://www.google.com.au/search?hl=en&q=pattern+climate+and+vegetation+in+Australia&meta=
 day 28
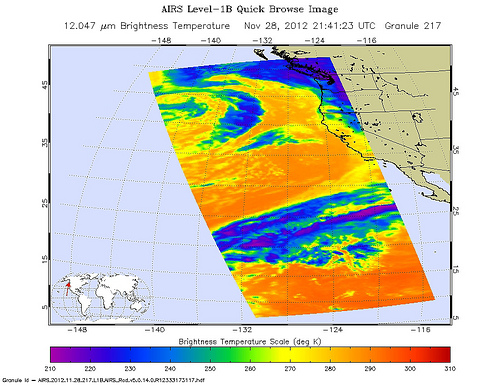 West Coast Atmospheric River Event November 2012
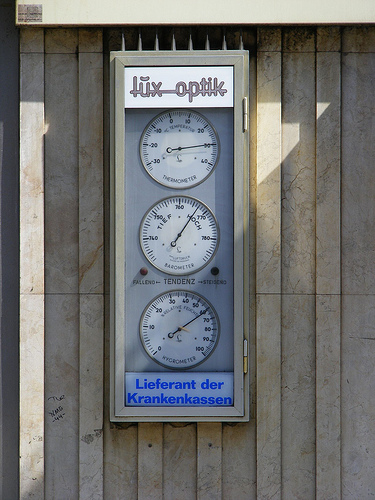 Lux Optik,Berlin Neukölln Aug 2010