Factor Analysis
Factor analysis attempts to identify underlying variables, or factors, that explain the pattern of correlations within a set of observed variables. Factor analysis is often used in data reduction to identify a small number of factors that explain most of the variance observed in a much larger number of manifest variables. Factor analysis can also be used to generate hypotheses regarding causal mechanisms or to screen variables for subsequent analysis (for example, to identify collinearity prior to performing a linear regression analysis).
The factor analysis procedure offers a high degree of flexibility:
Seven methods of factor extraction are available.
Five methods of rotation are available, including direct oblimin and promax for nonorthogonal rotations.
Three methods of computing factor scores are available, and scores can be saved as variables for further analysis.
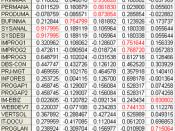
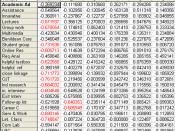
Rotation. In rotating the factors, we would like each factor to have nonzero, or significant, loadings or coefficients for only some of the variables.
Likewise, we would like each variable to have nonzero, or significant, loadings with only few factors, and if possible, with only one. If several factors have high loadings with the same variable, it is difficult to interpret them.
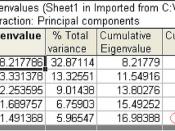
Statistics. For each variable: number of valid cases, mean, and standard deviation. For each factor analysis: correlation matrix of variables, including significance levels, determinant, and inverse; reproduced correlation matrix, including anti-image; initial solution (communalities, eigenvalues, and percentage of variance explained); Kaiser-Meyer-Olkin measure of sampling adequacy and Bartlett's test of sphericity; unrotated solution, including factor loadings, communalities, and eigenvalues; rotated solution, including rotated pattern matrix and transformation matrix; for oblique rotations: rotated pattern and structure matrices; factor score coefficient matrix and factor covariance matrix. Plots: Scree plot of eigenvalues and loading plot of first two or three factors.
Assumptions. The data should have a bivariate normal...


