Fluorescence Study of the Kinetics of Energy Transfer Between Dyes 1. Introduction Coumarin 1 and Sodium fluorescein are two dyes which absorb and emit light in the visible region. By using a spectrophotometer we are recording an absorption spectrum and then determining the molar decadic absorption coefficients, which will be used later to interpret and analyse the fluorescence spectra.
For fluorescence spectra, there are two kinds, the excitation and the emission spectrum.
The excitation spectrum is obtained by measuring the intensity of the emission as the excitation wavelength is altered by scanning a monochromator. The emission spectrum is obtained by measuring the emission intensity as a function of wavelength for excitation at a fixed wavelength.
An absorption spectrum and an excitation spectrum are by their nature actually equivalent.
The two dyes exhibit energy transfer properties. The donor is coumarin and the acceptor the fluorescein. When the donor is excited, it is naturally decaying to the ground state.
 Emission Spectrum Scarf (Lithium)
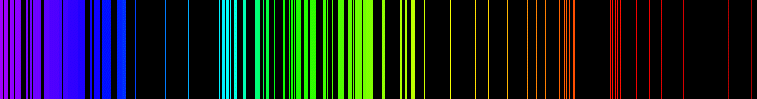 Electromagnetic emission spectrum of Iron in the v...
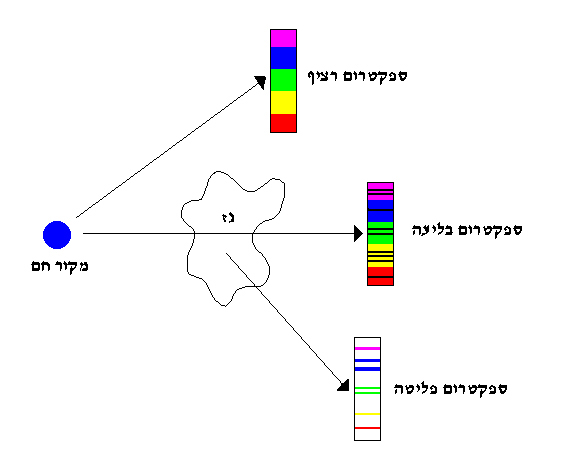 Emission Spectrum, Absorption spectrum, Continuous...
However in presence of an acceptor, this process is enhanced trough energy transfer. We will distinguish between collisional energy transfer and dipole-dipole transfer. From here we will try to determine the quenching constant and the distance at which decay and energy transfer are equally probable, as well as prove that Stern-Volmer's law and Förster's theory are obeyed.
2. Results 2.1. Electronic Absorption Spectra We made up stock solutions for both salts and diluted them down to use in the UV/vis spectrometer.
Coumarin 1 C = 8 x10⁻⁵ mol dm -3 We obtained a spectrum with a maximum at 376.5nm at an absorbance of 1.4573, using Beer-Lambert's law, we deduced the molar decadic absorption coefficients.
Sodium fluorescein C = 2.425 x10⁻⁵ mol dm -3 Here max was 500.5 nm at an absorbance of 2.0922 Summary of the results obtained.
Dye max (nm) max (m2 mol-1) (m2 mol-1) ' (m2 mol-1) D (Coumarin) 376.5 1.82 x 10⁹ --- 1.25 x 10⁶ A (Fluorescein) 500.5 5.17 x 10⁷ 1.41 x 10⁶ 8 x 10⁶ 2.2. Fluorimetry a) Perylene standard /nm I Emission Spectrum 438 4.063 EX = 434nm 467 2.620 Excitation Spectrum 410 2.755 EX = 438nm 437 4.208 These are the values for the maxima in both spectrum, for the graphs, see attached sheet.
b) Coumarin 1 C = 4 x10⁻⁶ mol dm -3 /nm I Emission Spectrum 374 1.050 EX = 377nm 443 4.081 Excitation Spectrum 373 4.156 EX = 443 nm 446 1.026 b) Sodium fluorescein C = 1.212 x10⁻⁶ mol dm -3 /nm I Emission Spectrum 516 7.453 EX = 501nm Excitation Spectrum 501 7.516 EX = 516 nm On the graphs of the standard and the two dyes, we can nicely see that the excitation and emission spectra are mirror images of each other overlaid.
The excitation wavelength in one is the highest emitting one in the other.
2.3. Energy Transfer Stern-Volmer equation 0 / = 1 + K [A] (1) with 0 / being the ratio of quantum yield and K being the Stern-Volmer quenching constant a) Experimental study To test the Stern-Volmer equation, as well as to prove the dipole-dipole transfer, we did fluorimetric measurements with mixtures of different concentrations of D and A.
[D] [A] I m ratio 0.003 0 70.238 1.001188 0.9883 0.003 4.042E-04 49.052 1.002212 1.4288 0.003 8.084E-04 38.766 1.003237 1.806 0.003 1.213E-03 31.416 1.004262 2.2263 0.003 1.617E-03 25.816 1.005285 2.7064 Table 1: Results from D-A mixtures experiments.
with I being the intensity of light emitted m being a geometric correction factor and ratio the ratio of the quantum yields Those values were used to fit the model expression (1), using the following program * NonLinear Regression.
MODEL PROGRAM K=1000000 .
COMPUTE PRED_ = 1+K*conc.
NLR ratio /OUTFILE='C:win95TEMPSPSSFNLR.TMP' /PRED PRED_ /SAVE PRED RESID /CRITERIA SSCONVERGENCE 1E-8 PCON 1E-8 .
Non-linear Regression Iteration Residual SS K 1 .0089160488 1000000.00 1.1 .0031167306 1034392.20 2 .0031167306 1034392.20 2.1 .0031167306 1034392.20 Run stopped after 4 model evaluations and 2 derivative evaluations.
Iterations have been stopped because the relative difference between successive parameter estimates is at most PCON = 1.000E-08 Nonlinear Regression Summary Statistics Dependent Variable RATIO Source DF Sum of Squares Mean Square Regression 1 18.55731 18.55731 Residual 4 3.116731E-03 7.791826E-04 Uncorrected Total 5 18.56043 (Corrected Total) 4 1.79521 R squared = 1 - Residual SS / Corrected SS = .99826 Asymptotic 95 % Asymptotic Confidence Interval Parameter Estimate Std. Error Lower Upper K 1034392.1957 12606.399781 999391.21871 1069393.1726 The crosses are marking the values obtained and the line is the fit based on (1).
So the best fit value for K is 1.034x10⁶, with at confidence limit of +/- 3.5x10⁴.
So K , the Stern-Volmer quenching constant is 1.034x10³ mol-1 dm 3.
Parent variance 2ratio = 2.43x10⁻⁴.
The mean square residual s2ratio is 7.79x10⁻⁴ Reduced chi-square 2v = 3.20.
A value under 3 indicates a good fit, hence this shows that our data, is not really fitted onto the model.
b) Energy transfer rate constant For coumarin, =0.64 Its intrinsic fluorescence lifetime is 0s = 1/(1.822x108) Therefore ktots = 1/ ( 0s) = 2.846 s-1 and ket = K ktots = 2.943x10¹¹ mol-1 dm 3 s-1 This value as an error estimation of +/- 9.961 x10⁹ mol-1 dm 3 s-1 And as ket kdiff , we can see that 98% of the total energy transfer is due to dipole-dipole transfer.
c) Förster energy transfer [A]1/2 = 9.67 x10⁻⁴ mol dm -3 Transformation of the raw data through SPSS gives us the following graph.
Values obtained: JDA = 6.897x1031 nm mol -1 R0 = 0.14 nm (R0)eff = 0.584 nm based on equation (A3-13) So we see that those are very clearly quite different, and that could show that it does not obey to Forster's theory.
3. Conclusion So we have shown that the quenching of Coumarin 1 by Sodium fluorescein is obeyed by Stern-Volmer kinetics, that there is mainly dipole-dipole transfer, but could not agree with Forster's theory.
 Emission Spectrum Scarf (Lithium)
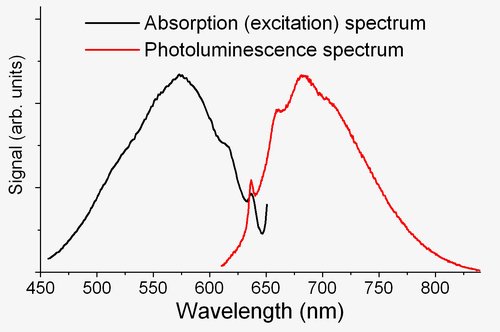 English: absorption/emission spectrum of N-V- cent...