The GIS and Australian Agriculture Geographic information systems are a combination of global positioning systems, which give longitude, latitude and elevation, satellite imagery, aerial photography, existing maps, land data and computer systems. All this information is combined to form the GIS. The result is stored computer information containing data about the Earth's surface that can be printed out or viewed directly from the computer. A possible disadvantage with the input of data by digitising paper maps or satellite imagery is that the data may not be accurate, so care should be taken with data reliability.
GIS technology integrates common database operations such as query and statistical analysis with the unique visualization and geographic analysis benefits offered by maps. GIS has benefits not only in storage and display of data, but also in the ability to bring together environmental data sets collected by different methods, and to integrate them together for improved data extraction and management.
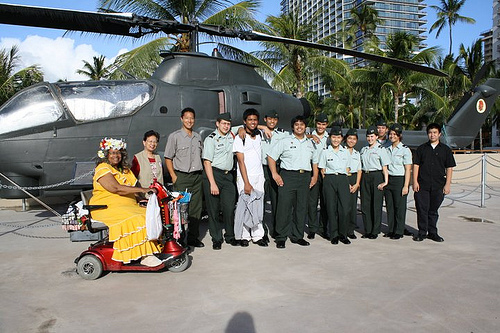 Geographic Information System Day at USACE Pacific...
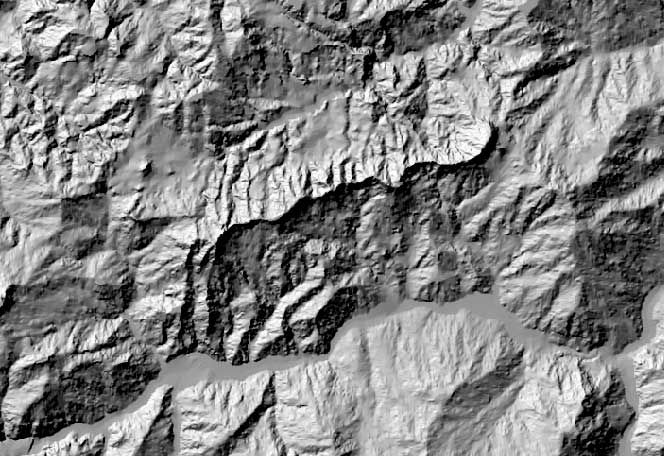 A digital elevation model (DEM) from which a water...
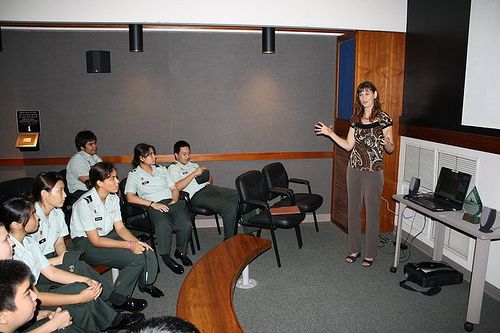 JROTC cadets attend UACE Geographic Information Sy...
GIS displays can be integrated with reports, three-dimensional views, photographic images, and other output such as multimedia. It gives the power to visualize scenarios, solve complicated problems, present powerful ideas, and develop effective solutions like never before. These abilities distinguish GIS from other information systems and make it valuable to a wide range of public and private enterprises for explaining events, predicting outcomes, and planning strategies.
The ability to bring together the results of conventional field mapping, satellite based interpretations of geographical structure, multi-sourced geophysical data and the results of regional surveys, and then to vary the weighting given to the different parameters can provide a unique insight into, for example, the location of areas that may potentially be affected by salinity. The addition of topography, together with factors such as basic hydrological and climatic information, population distribution, ecological factors, and land use takes one to the stage of planning and environmental impact. The power of such a tool is that variations in weighting can be made to explore how the natural environment is best utilized and protected, and how various factors may interact and affect each other.
GIS technology also offers many tools for manipulating spatial data and ignoring unnecessary data.
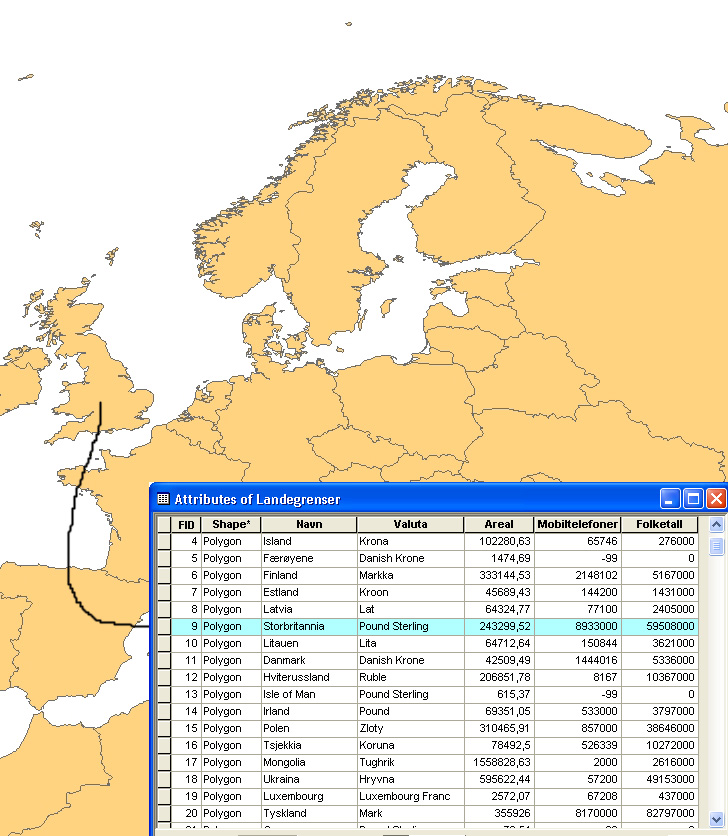
The output generated by GIS is in forms which are easily understood and used by land holders and land management authorities. Often the output is in the form of colour-coded maps showing areas with different levels of a quality of interest; for example, highly fertile areas, areas in which plants show signs of stress and infertile areas. This information is useful for monitoring problems, developing effective strategies for amelioration and analysing the success of these strategies. GIS is particularly useful for monitoring problems because it gives us a large scale perspective at a catchment or multi-catchment level. Monitoring also contributes to the development of strategies to solve the problems. An understanding of how salinity affected areas are related to other features of the landscape, such as land use or topography, helps us identify causes of the problem.
It also lets us target amelioration strategies either to the worst affected areas, or to the areas in which the strategy will be most effective. Areas at risk can be identified and preventative action taken. In addressing problems like salinity, erosion and declining fertility it is often useful to identify alternative land uses which will control the problems while maintaining the economic feasibility of the farm. GIS can be used to match features of the landscape with requirements for industries sustainable in the long-term. Once strategies have been implemented, continued monitoring tells us whether they are improving the situation, the problem is worsening, or an equilibrium has been reached.
Some of the major challenges to agriculture faced today - such as salinity, erosion, and declining fertility - have a critical geographic dimension. The particular strength of GIS is the power of being able to combine independent data sets, which cross traditional boundaries (geology, environmental science, engineering), and thereby solve problems that can be difficult to resolve by other means. Thus, for example, a map of annual soil loss can be computed by combining digital maps of annual rainfall, soil erodibility, slope angle, length of slope and land cover information in a simple arithmetic overlay operation. The essentially spatial nature and constituents of the landscape, together with the flow of materials such as soil, water, energy and even species between landscape elements, constitutes both a fixed and time varying model that the GIS system can handle quite effectively. The outputs of such modelling are maps that can be used as a basis for land use planning, identification and management of environmentally sensitive areas.
GIS is a helpful tool in fixing these problems that reduce farm productivity. Adding drains to remove excess winter rainfall as quickly as possible can reduce salinity. This requires the building of drains in the affected areas on a farm. GIS can be used to see where the drains are needed and will help with deciding on the orientation of the drains so that the water is carried away where it will not create further problems. Control of water application during any rainfall period is very important which will minimise recharge to groundwater. Uniform water application is necessary and GIS can help with this also.
Variable climates, cultivation, overstocking, lack of vegetation and salinity can all predispose to erosion. Using GIS to reduce salinity may also be a step towards reducing erosion if the eroded area is found to be salty by GIS. Another way erosion may be reduced by GIS is by looking at an area that is predisposed to erosion because of variable climate and a light soil type with low vegetation cover. This area should have more pasture on it before stocking, minimal tillage should be applied and overstocking should be avoided.
Declining fertility is an important GIS application. Land is not uniform in its fertility, even over relatively small areas so fertiliser need not be applied uniformly. GIS can use the relationship among variables such as nutrient values, soil types and moisture levels to create 'fertiliser prescription contour maps that are used with variable rate application field equipment to improve yields'. This will increase profits, in turn enabling land owner's to invest more into the farm to increase output.
GIS technology integrates common database operations such as query and statistical analysis with the unique visualization and geographic analysis benefits offered by maps. The particular strength of GIS is the power of being able to combine independent data sets, which cross traditional boundaries (geology, environmental science, engineering), and thereby solve problems such as salinity, and soil erodibility, that can be difficult to resolve by other means.
References: Environmental Informatics, Geographic Information Systems, 2000, http://webraft.its.unimelb.edu.au/212205/prot/pres/geoginfsyst/
 GIS
GIS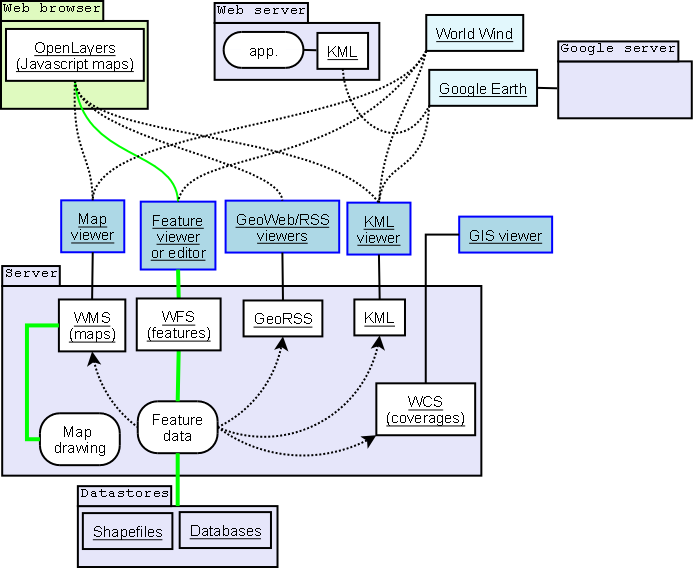 Geoservices server with interfaces and application...
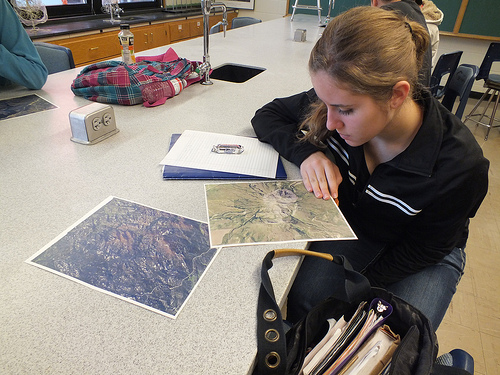 Ecology class learning about how NRCS helps people...