INTRODUCTION
Graphs are diagrams that represent the information in a pictorial way, showing the relationship between two variables. All graphs need a table were the information is shown; however, the graphs may not always show the table since they are self explanatory by themselves. There are many types of graphs that are useful depending on the information you want to exhibit and how you want to do it. Graphs are very useful because they communicate the information visually. Also graphs are used everywhere in newspapers, magazines and websites, that's why it is important to know how to read them. The different types of graphs may include qualitative or quantitative information depending on the characteristics of each. The following shows just some of the graphs that are used to exhibit data they are: the bar diagrams, segmented bar diagrams, grouped bar diagrams, pie charts, histograms, frequency polygon, cumulative polygon and ogive.
 C-3PO vs. Data (137/365)
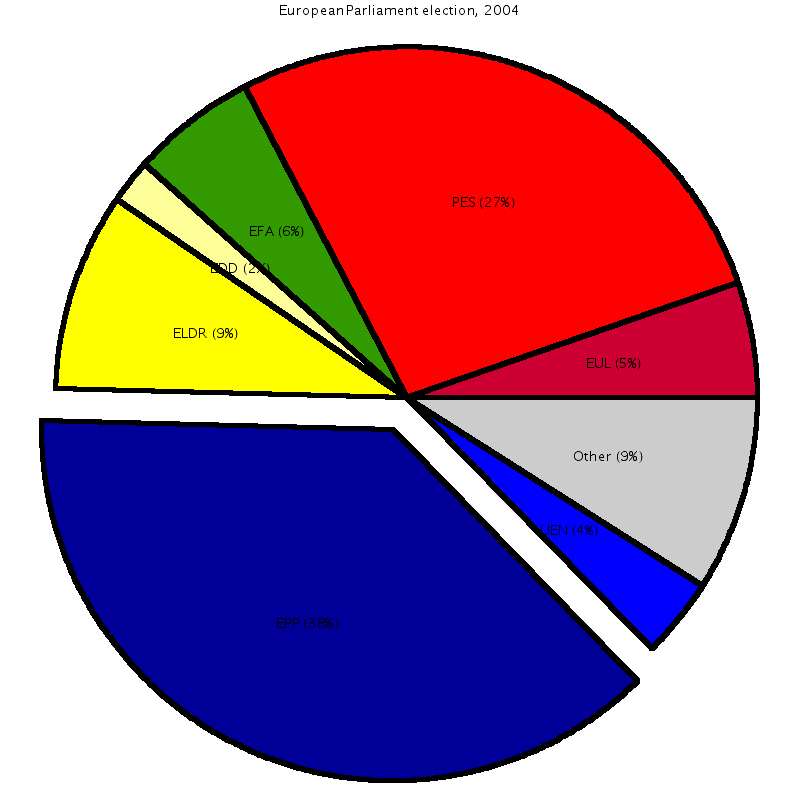 An exploded pie chart for the example data, with t...
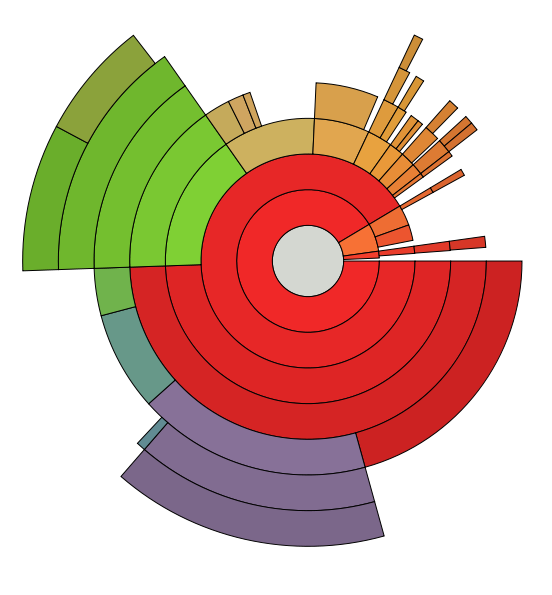 Screenshot of for illustration of Multi-level Pie ...
STATISTICAL GRAPHS
The first thing you have to notice or decide before graphing or looking at a graph is the variable. The variable is a very important part on the graph because it's what all the data on the graph is based on. The two types of variables are the categorical or qualitative and the numerical or quantitative. The numerical or quantitative data focuses on numerical measurements or counts. This data may also be separated into two other variables that are the discrete and continuous. The discrete variable is the one that has a countable or infinite number such as 23 students or 5 teams and the continuous variable is the one that can be used for measurements, for example speed or weight. Instead, the qualitative or categorical data describes the quality of something in a non-numerical format. Counts may be applied to this type of data;...
Graphs!
Wow, you spent alot of time on this! Good job it was an interesting read. Even though kinda boring but all in all it was good!
0 out of 0 people found this comment useful.