Investigating the rate of reaction between Sodium Thiosulphate and Hydrochloric Acid
Diagram
Aim : We did 4 experiments to find out how the rate of reaction changes with differing concentrations of Sodium Thiosulphate, Hydrochloric Acid and water. As an inert and stable liquid, water was used to alter concentration of Sodium Thiosulphate without changing the end amount of solution. All the atoms in a water molecule have a full outer shell, so they would not react with the other chemicals.
Equipment : Beakers,
Measuring cylinders
Clamp stand and Clamps
Black paper tube
Light probe and Blue box
Datalogger
Lamp
Total of 30cm3 H 0, 50cm3 Na S O , 12cm3 HCl
Method : We wanted to change the concentration of Sodium Thiosulphate and Hydrochloric Acid, but without changing the overall quantities. To do this, the Sodium Thiosulphate and water were mixed at different ratios, with always a constant amount of acid.
 Experiment
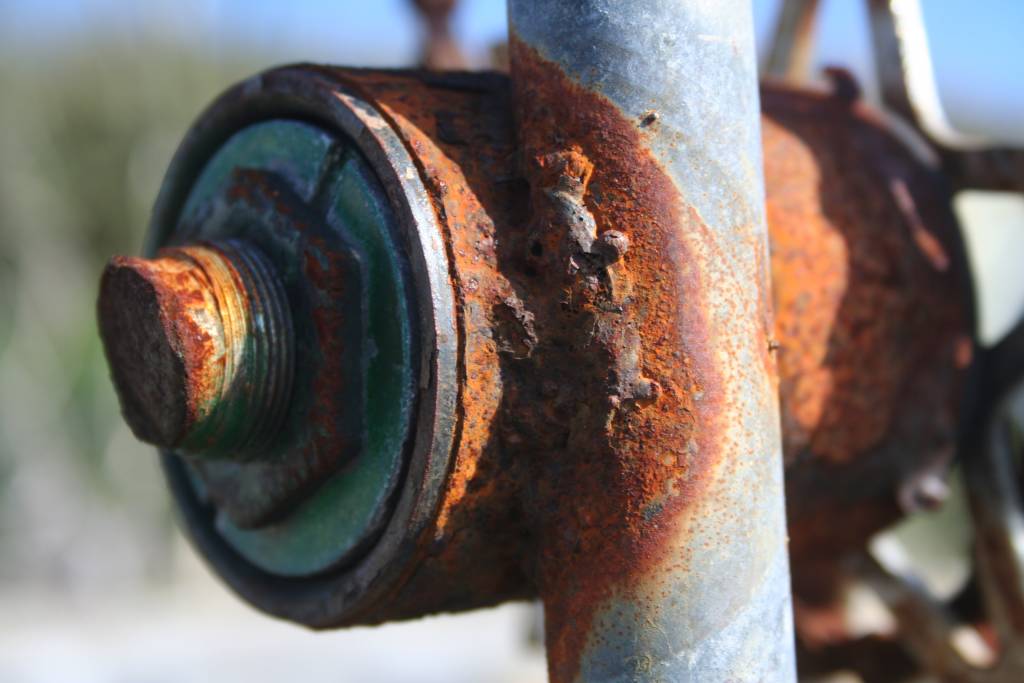 Rusting can completely degrade iron. Note the galv...
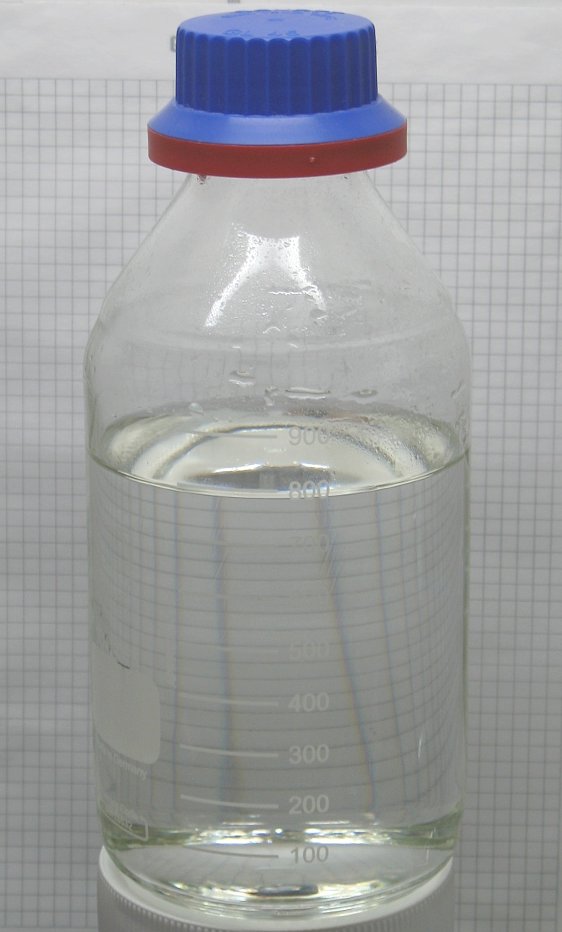 English: 30% hydrochloric acid
The table below shows the 4 different experiments, and what each solution composed of. The 'Graph' column relates to the graphs taken from the Datalogger for that experiment, which are included at the back of this piece.
Sodium Thio-sulphate (cm3) Water (cm3) Hydrochloric Acid (cm3) Graph number
20 0 3 DPPAS_02
15 5 3 DPPAS_03
10 10 3 DPPAS_04
5 15 3 DPPAS_05
We did not do the experiment in which 0cm3 Sodium Thiosulphate and 20cm3 water were used, as there would have been no reaction. In total, there were always 20cm3 of water and Sodium Thiosulphate, with 3cm3 Hydrochloric Acid, giving a total solution of 23cm3
The black tube was put around and below the beaker to help prevent any unwanted light from entering the light probe, as this would have impaired our results.
The reason we used a Datalogger and light probe instead of the old...