Introduction
The economic situation differs from country to country because of the differences in populations, geography, monetary system, political situation and other factors. In addition, within one country, there are always a number of regions that differ from one another by their economic performance. What does the future hold? This is the question the government, economists, investors and public all would like to know the answer. Macroeconomics is the study of the behavior of the economy as a whole. This is different from microeconomics, which concentrates on individuals and how they make economic decisions. Macroeconomic forecasts is the results of macroeconomists who try to forecast economic condition to help consumers, businesses and governments to make better decision. Macroeconomic analysis mainly focuses on national output or GDP, unemployment rate, inflation rate, etc. In this paper, we will gather three different macroeconomic forecasts for the next two year from different agencies, and provide an analysis on several forecast's statistics.
Macroeconomic Forecasts
In order to accurately analyze the macroeconomic forecast, we will use the forecasts that are prepared by three different entities; government agency, business company, and academic research. The following three tables will show the macroeconomic forecasts for percentage change in real GDP, unemployment rate, Consumer Price Index, 3-months Treasury Bond Rate, and Housing. Those forecasters also produce the forecast for other economic variable, but we the five indicators mentioned above will be analyzed in this paper.
The following table shows the macroeconomic forecasts for 2005-2006 from Congressional Budget Office, (CBO)
Indicators 2005 2006
Real GDP (% change year-over-year) 4.5 4.1
Unemployment rate (%) 5.6 5.2
Inflation (CPI) 2.6 2.0
3-months Treasury Bond Rate 1.3 2.6
Housing Starts (Millions) NA NA
The following table shows the macroeconomic forecasts for 2005-2006 from Wachovia, a financial service company (Wachovia)
Indicators 2005 2006
Real GDP (% change year-over-year) 3.5 2.7
Unemployment rate (%) 5.1 5.0
Inflation (CPI) 3.4 3.7
3-months Treasury Bill Rate 3.49 4.7
Housing Starts (Millions) 2.03 1.95
The following tables show the macroeconomic forecasts for 2005-2006 from University of Michigan (University of Michigan)
Indicators 2005 2006
Real GDP (% change) 3.6 3.6
Unemployment rate (%) 5.1 4.7
Inflation (CPI) 3.3 2.9
3-months Treasury Bill Rate 3.1 4.0
Housing Starts (Millions) 2.03 1.94
Gross Domestic Product
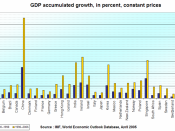
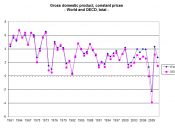
The primary measure of the performance of the economy is its annual total output of goods and services, or aggregate output (McConnell-Brue, 2004). The total output is labeled as gross domestic product or GDP. The use of GDP as a summary measure of the level of economic activity is pervasive in policy analysis and forecasting. In standard macroeconomic analysis, GDP is used to measure the dynamic behavior of an economy via GDP growth, the difference between actual and potential GDP, the turning point of the business cycle, etc. The GDP estimate for a specific year is subject to several revisions after its first release. As the result, both the level and the profile of GDP from a forecaster may change, sometimes substantially, through time. From the above tables, we can see that the COB had estimated a larger percentage change in GDP compared to Wachovia and University of Michigan's estimate. In CBO's estimation, the economy has entered an investment-growth phase. In the investment-growth phase, the number of jobs will rise and real GDP will expand faster than its trend rate (CBO). The smaller percentage change in real GDP forecast from Wachovia and University of Michigan takes into the impact of hurricane. Because of the Hurricane Katrina and Rita, a temporary loss of domestic energy production along with the output losses due to damage of oil refineries and other business imply a small loss of GDP in the second half of 2005 (University of Michigan). Economists expect that there will be a substantial response from federal to the devastation from the hurricanes and estimate that federal spending will be up $100 billion over the next few years in support of the rebuilding process (University of Michigan). This will show up in GDP recovery beginning in 2006
Unemployment rate
There are always two problems that arise from the business cycle are unemployment rate and inflation. In this section, we will discuss unemployment rate. In economic definition, a person who is able and willing to work but is unable to find a paying job is considered unemployed. The unemployment rate is the percentage and can be calculated by dividing the number of unemployed persons by the total civilian labor force. The total civilian labor force includes both employed and unemployed. Unemployment rate that is above the natural rate might involve great economic and social costs (McConnell-Brue, 2004). Jobless can hit individuals hard. Without a job often means lacking social contact with fellow employees and the ability to pay bills and to purchase goods and services. High unemployment rate can imply low real GDP. The relationship between unemployment rate and GDP is that we do not use our resources as completely as possible, and therefore wasting our opportunities to produce goods and services. When people loses job, their family and the country as a whole lose. The worker loses wages, and the country loses goods and services. Furthermore, the purchasing power of these unemployed workers is lost, which can lead to the unemployment for other workers. Unemployment rate forecast can help government or policy makers to know about the extent and nature of the problem, and with proper interpretation, other measures should be taken to influence the course of the economy to aid those affected by joblessness. For example, during 2000-2001, the Bush Administration extended the unemployment benefit to those who lost their jobs. As we can see from the three forecasters above, the unemployment rate in the two years forecast is related to the forecaster's estimate of the gap between GDP and potential GDP. As the gap is eliminated, the unemployment rate is expected to fall over the next two years, 2005 and 2006.
Inflation (CPI)
Inflation is a rise in the general level of price. When inflation increases, it will reduce the purchasing power of money because each dollar income will buy less goods and services (McConnell-Brue, 2004). The main measure of inflation is the Consumer Price Index or CPI (McConnell-Brue, 2004). The government uses this indicator to adjust Social Security benefit and income tax bracket. The CPI represents the cost of a basket of goods and services used by the average consumer. The annual percentage change in the value of this index is one way of measuring the annual inflation rate. Because of the rapid-growth of U.S economy has been in the recovery phase in the last few years, the CPI is little high in the year 2005. However, we will see the inflation will begin to ease and decline in 2006. The reason for declining in inflation is due to the slower growth of 2006 as indicate by the slower percentage change in 2006 compared to 2005. All three forecasts show a decline in CPI in the year 2006. However, the CBO's forecast of CPI is lower than the forecast from Wachovia and University of Michigan. With the same reasoning for the difference in forecasting the percentage change in GDP, we can assume that the CBO's forecast does not take into account the impact of recent hurricanes. The oil production in the Gulf of Mexico was greatly affected by Katrina and Rita. The region is responsible for 28.7% of U.S crude oil production, 47.7% of U.S. oil refinery capacity, and 20% of U.S. natural gas production (University of Michigan). After the Katrina and Rita, oil and gas production in the Gulf region were at 2.2% and 24.6% of its normal, respectively (University of Michigan). As expected, energy price will rise sharply and cause CPI to rise.
Treasury Bill Rate
Generally, consumers and economist often talk in term of a single interest rate or prime rate; there are actually a number of interest rates. 3-months Treasury Bill Rate is one of them and is interest rate on Federal government security used to finance the public debt (McConnell-Brue, 2004). Since June of 2004, FOMC has increase the federal funds rate at its eleven straight meetings. All three forecasts expect that the interest rate continues to rise as the economy continues to grow. This is expected because when the economy is growing, the Fed will attempt to balance between growth and inflation within acceptable level by raising interest rates to prevent the economy overeating and inflation in check (Salter, 2005). As we have seen in the last few years, the U.S. economy is in the growing stage and will continue to grow in the next two years; the Fed will continue to raise interest rate to keep inflation at the acceptable level.
Housing
In addition to GDP, unemployment rate, inflation rate, and interest rate, housing starts is also one of the leading economic indicators. When interpreting the housing starts, we can arrive at a conclusion that a higher-than-expected increase in housing starts will trigger economic growth. It will be considered as inflationary and can cause bond prices to fall and yields and interest rates to rise. Conversely, a decline housing activity will slow the economy and can push it into a recession. This will cause bond price to rise and yields and interest rates to fall. Both Wachovia and University of Michigan's forecast show that there will be a decline in housing starts. The reasoning for slowing in housing start is because of the lower growth in GDP and higher interest rate. Even though the CBO does not provide estimate on housing start, it does indicate that the housing activity will be slower in 2006 due to higher interest rate and expected hike in mortgage rates. As CBO states in its website,
With construction and sales of homes already at record highs and mortgage rates likely to rise further, residential investment during the remainder of 2004 and in 2005 is expected to curb the growth of demand. The lowest mortgage rates in more than 30 years led to home sales in 2003 that surpassed all other years', giving a big boost to construction. Although mortgage rates have since risen, the low level of rates relative to those in the past, the anticipation of further rate increases, and the growth of employment have kept home buying strong. CBO foresees further hikes in mortgage rates and, as they occur, a slowdown in housing activity from its current level. That slowdown could be worse than anticipated if purchasers of homes today have unrealistic expectations about how much their homes will appreciate and potential buyers revise those expectations downward (CBO).
Planning and Operation in the next two years
For the next two years, my company is expecting to continue the policy of hiring freeze, start construction of new building in the next few years and continue to invest cash surplus in T-Bond. With the forecasts we discussed above, I would recommend the upper management to start hiring new employees because of several reasons:
GDP continues to grow to imply products and goods will be purchased more by consumers, it will lead to the need of expanding the production output. With an increase in production output, more workers are required.
Unemployment rate will be lower in the near future. It means that the available of workers with certain skills will be in high demand. If we can hire those workers now, it will not disrupt the production when the operation requires more workers in the near future.
With the expected interest rate to rise and higher mortgage rate; starting the construction of new building will save money in mortgage loan. In addition, cost of goods and services will be higher in the near future; there will be a higher cost in construction's material. This will lead to a higher cost in building.
Nevertheless, the expected interest rate to rise means the T-Bill Bond will provide a better return of investment. Therefore, the company should continue to invest its cash surplus in T-Bond.
Conclusion
The performance of the economy is important to all of us. We analyze the macro economy by primarily looking at national output, unemployment, inflation and interest. Even though it is consumers who ultimately determine the direction of the economy, governments also influence it through fiscal and monetary policy. With the accurate and timely information about what likely happen to the economy, governments and businesses alike can make sound decisions to ensure the economy to grow with an acceptable rate and help businesses to prosper.
References:
CBO. The Buget and Economic Outlook: An Update. Retrieved October 21, 2005, from http://www.cbo.gov/showdoc.cfm?index=5773&sequence=1&from=0
McConnell-Brue (2004). Economics - Principles, Problems, and Policies, 16th Ed. McGraw-Hill 2004.
Salter, S. N. (2005, Feb) Demystefying the Fed. Sales & Management, 157(2) pg. 54.
University of Michigan Forecast. Executive Summary. Retrieved October 21, 2005, from http://www.umich.edu/~rsqe/summary.pdf
Wachovia. Monthly Economic Forecast. Retrieved October 21, 2005, from http://www.wachovia.com/corp_inst/page/0,,13_54_1067,00.html


