KAPS1.A piece of string was tied to 2 chairs so that the string hangs down fairly loose.
2.Both chairs had the same height off the floor, and the string was made sure that they were tied to the same position. (88cm)3.As it can be seen on the table below, the height from the floor to the string was measured from eleven equally distant points along the floor.
Points (cm)Height from the point to the string (cm)0884070.5805712048.516042.520040.524042.528047.532056.536069.5400884.A graph was drawn using the supports as the y-axis and the floor as the x-axis. (Attached on the end of assignment criteria sheet provided)5.From looking at the scatter plot, the function looks like a quadratic function. Therefore, I will assume that y = ax2 + bx + c.
ÃÂThe constant c is the value of y when x=0ÃÂ [http://www.ucl.ac.uk/Mathematics/geomath/rev/quadnb/ql11c.html].
Therefore,c = y-intercept = 88Now we must find out a, being the dilation.
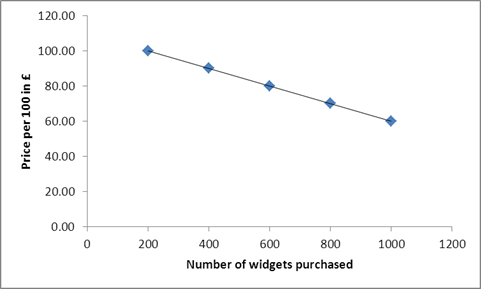 English: A scatter plot illustrating inverse corre...
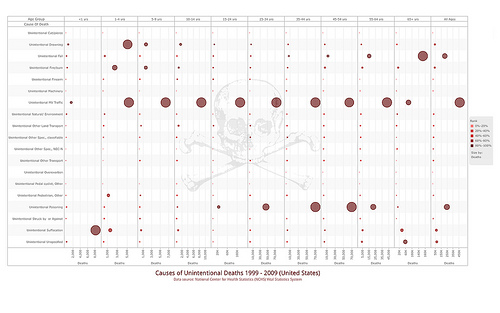 Unintentional Deaths 1999 - 2009 (United States)
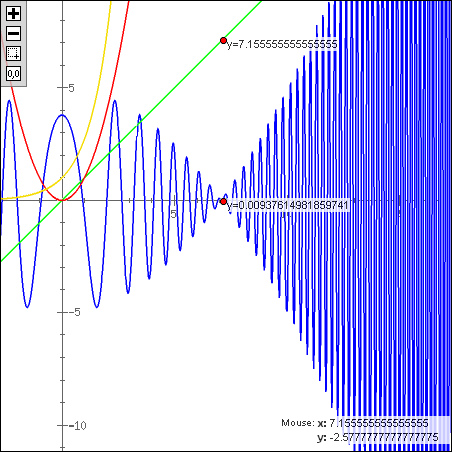 Online Graphing Calculator
To find this out, we must begin by taking the middle point of the curve till the final point of the curve, therefore, points 6, 7, 8, 9, 10 and 11. We will make the 6th point starting from 0cm, as if we start off from 200, the x value will not be constant. To make it constant, we must make the difference between the y-intercept to the 6th point and the difference from 6th point to the 7th point to be exactly the same. (See table below)y 40.542.547.556.569.588x04080120160200Now, we must square the x value to see if it forms a straight linear graph. (see table andy40.542.547.556.569.588x2016006400144002560040000As it can be seen on the graph above, the graph is very close to a perfectly straight line, therefore the assumption of a quadratic model was correct.
Now,m = â³y/â³xUsing points, (0,40) and (40000, 88)m = (88 à40) / (40000-0)m = 48 / 40000m = 0.0012Since a is the gradient, a = m= 0.0012Now that we have the value of a and c, we could now substitute these values into the quadratic formula along with the point from the original table. (NOTE: must be from the original table, and the point must be the point which is located where the curve is going upwards, as that is where we got the value of a before.)Therefore,y = ax2 + bx + cy = 0.0012x2 + bx + 88Substitute point (320,56.5)56.5= 0.0012 x 3202 + 320b + 8856.5= 122.88 + 320b + 88320b = -154.38Therefore,b = -0.4824375b = -0.48Therefore, the rule for the data is, y = 0.0012x2 à0.48x + 886.The points were entered into excel to produce a graph of the data. (See graph on next page.)7.As it can be seen above, the mathematical model for the data collected wasy = 0.0012x2 à0.4739x + 87.853, with an R2 value of 0.9992, which is extraordinarily close to 1, therefore proving us clearly that the data forms a parabolic function.
8.Using the graphics calculator, a graph, a model and a table were produced. See pictures below.
Graph produced using graphics calculatorModel produced using graphics calculator #1 (R value and the model itself)Model produced using graphics calculator #2 (Used as line of best fit)Table produced using graphics calculator9.aslkdjfMAPS10.Calculate the minimum height of the string from the ground algebraically using:Thinking logically, if something straight (in this case, the string) is hanged down fairly loose from two supports, the point which is exactly in the middle - the point where the distance from the two supports equal - must be the point which has the minimum height off the floor, assuming that the string itself is not out of proportion in mass or in shape. Therefore, the point with the lowest height off the floor is the 6th point, which are is located exactly 2 metres from the chair on both sides.
a) Original scatter plot:Referring to the data used to sketch the scatter plot, the lowest point must be the 6th point, with a minimum height of exactly 40.5cm off the ground.
Therefore, the minimum height off the ground is 40.5cm.
To find out the minimum height off the floor for the next 3 models, we must substitute the 6th point, which has a value of 200cm as the x value.
b) Model produced in step 5 of KAP:y = 0.0012x2 ÃÂ 0.48x + 88 (model produced in Q5)substitute, (200, y)y = 0.0012 x 2002 ÃÂ 0.48 x 200 + 88y = 40Therefore, the minimum height off the ground is 40cm.
c) Model produced using excel:y = 0.0012x2 ÃÂ 0.4739x + 87.853(model produced in Q6)substitute, (200, y)y = 0.0012 x 2002 ÃÂ 0.4739 x 200 + 87.853y = 41.073Therefore, the minimum height off the ground is 41.073cm.
d) Model produced using graphics calculator:y = 0.00118043414918x2ÃÂ 0.47387820512823x + 87.853146853148(model produced in Q8)substitute, (200, y)y = 0.00118043414918 x 2002 ÃÂ 0.47387820512823 x 200 +87.853146853148y = 40.29487179Therefore, y = 40.295Therefore, the minimum height off the ground is 40.295cm.
As it can be seen on the 4 different types of model, the minimum height off the ground varies, why could this be possible, when the values we started off with were all the same? And this point leads me to the next question.
11.Differences in ResultsScatter plot: 40.5cmModel produced in question 5:40cmModel produced using excel:41.073cmModel produced using GC:40.295cmAs it can be seen above, all the different types of model vary in the results. This was due to the different mathematical formula we used to calculate.
If we assume that the string was straight and the string had the same width and mass throughout the whole string, the scatter plot should be the most accurate model, as the height was physically measured at the lowest point. But if the string was old, not straight and some parts were torn making the width and mass different throughout, it would definitely influence the results. And thatÃÂs when we have to use other methods. For example, the graphics calculator model can be used to see the pattern, and find out the lowest point, which could possibly be situated not in the middle of the two supports but somewhere else.
In this investigation, the string used was new, and the string was made sure that it was straight and had no sign of variable, which might have influenced the results. But, if the string was not straight, a statement could be made. ÃÂThat the middle point of the scatter plot was not the lowest point.ÃÂ If that was the case, using the graphics calculator model would be the most exact, as it is the most precise equipment to find the pattern/function of the curve.
In any case, I prefer not to use the model produced in question 5, as it was basically made by using only few of the points instead of all. Also, the model produced in excel can not be preferred as well, as all the calculation in this model was made only up to 4 decimal places, where as, the decimals for the graphics calculator had over 10 decimal places.
Summarise Q11Scatter plot: Most precise. It is the physical measurement taken. (NOTE: if the condition of the string is bad, this method is not precise.)Model produced in question 5: The least precise. Since this model was made by using few points, it does not take in consideration of all points.
Model produced using excel: Less precise. It was only taken to 4 decimal places which only gives a ÃÂapproximateÃÂ result.
Model produced using GC: Precise. It was taken to over 10 decimal places, but it is still not a perfectly definite model of the result.
Bibliography:Search Engines:www.google.comWebsites:http://www.ucl.ac.uk/Mathematics/geomath/rev/quadnb/ql11c.htmlAll accessed online on 01.09.06
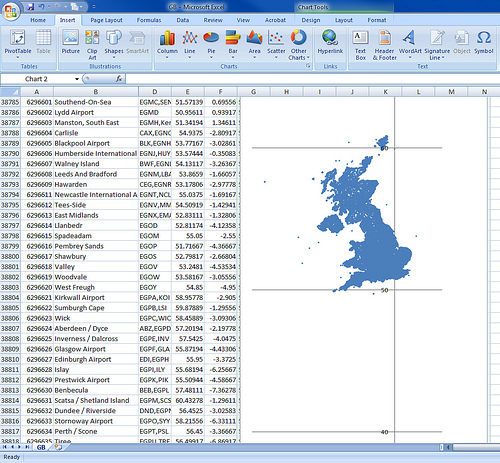 GB-Scatterplot
 Canon Rebel XS with TI calculator as intervalomete...
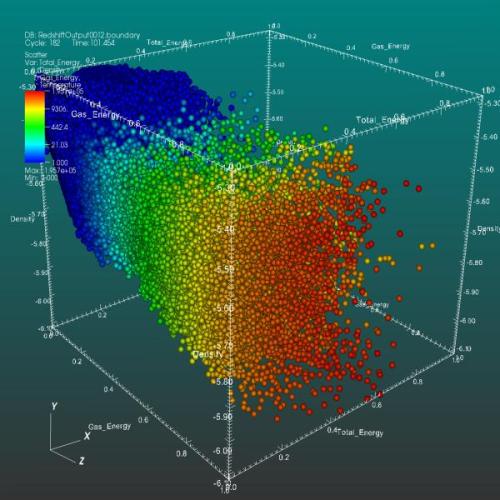 English: Scatter plot VisIt's Scatter plot allows ...